Most live transfer campaigns are bleeding money because they mistake activity for pipeline. While industry standards sit at 5–12% contact rates, high-performing operators hit 25–40%, the difference between buying leads and building a predictable revenue engine.
Consider the math: a $65 transfer with a 58% acceptance rate doesn’t actually cost $65; it costs $112. Vendors sell you the first number; your floor pays the second.
Closing this gap isn’t about the channel; it’s about architecture, qualification, and execution. This guide breaks down the three layers that define your ROI: vertical-specific qualification, structural campaign design, and the five gates of vendor evaluation.

Why Contact Rate Determines Live Transfer Campaign ROI
Contact rate is the single metric that determines whether a live transfer campaign produces ROI. Industry-typical operations run at 5 to 12 percent. Operator-led BPO with multi-channel infrastructure runs 25 to 40 percent. The gap multiplies through every downstream metric.
The Contact Rate Math at Operator Scale
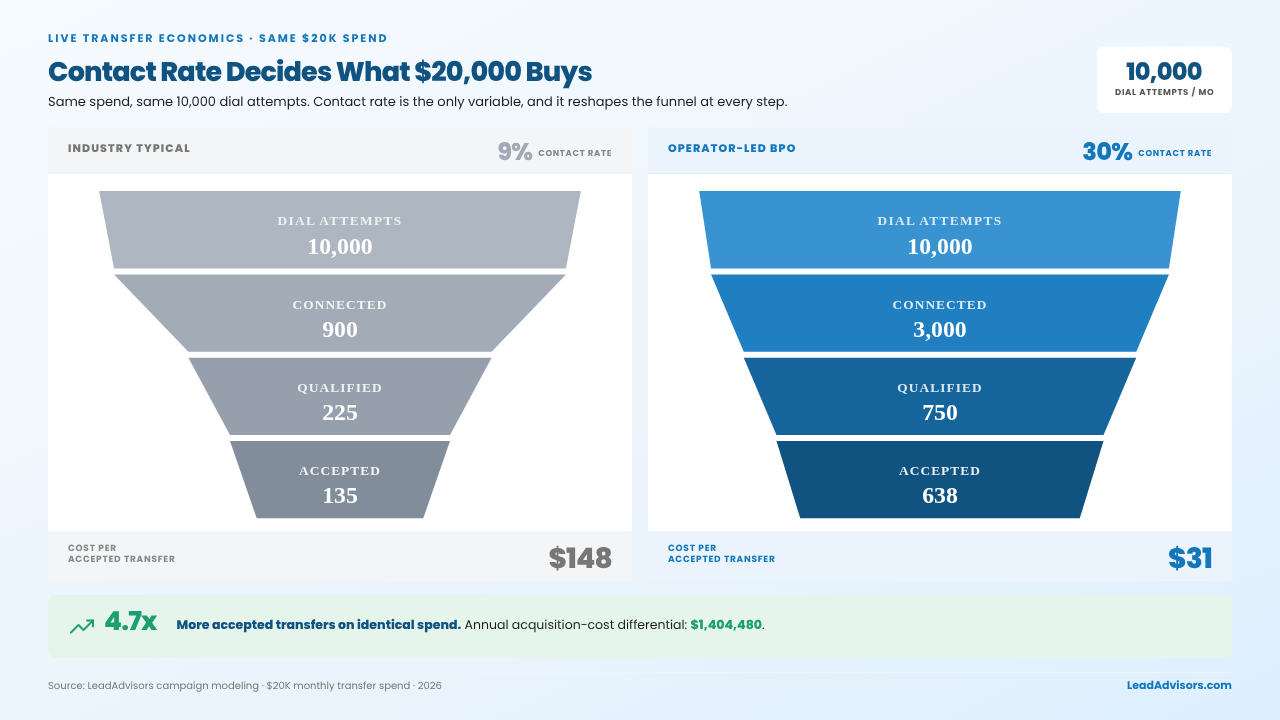
Run the math on a $20,000 monthly transfer campaign: 10,000 dial attempts per month, with 25 percent of contacts meeting transfer criteria.
Industry typical vendor at 9 percent contact rate:
- 900 connected conversations
- 225 qualified transfers attempted
- At a 60 percent transfer acceptance rate, 135 transfers were accepted
- Cost per accepted transfer: $148
Operator-led BPO at 30 percent contact rate:
- 3,000 connected conversations
- 750 qualified transfers attempted
- At 85 percent transfer acceptance: 638 transfers accepted
- Cost per accepted transfer: $31
Same $20,000 spend. 4.7x more accepted transfers at the higher contact rate.
Why Phone-Only Campaigns Cap at 12 to 18 Percent
Phone-only outbound has structural ceilings. Time-of-day windows are limited. Decision-makers screen calls. Spam likelihood scoring suppresses connect rates. Single-channel attempts produce single-channel answer rates.
Multi-channel orchestration breaks the ceiling. SMS gets read within two minutes. Email establishes context before the dial. Chat AI surfaces inbound intent. Phone dials hit prospects who already have context from prior touches, which is the core of how operator-led outbound calling for high contact rates is built.
The compound effect drives the 25-percentage-point gap between industry typical and operator-led BPO.
Speed-to-Lead as a Contact Rate Multiplier
Leads contacted within 5 minutes of expressed intent convert at 21x the rate of leads contacted at 30 minutes. The odds of qualifying a lead drop 80 percent after the first 5 minutes.
Every hour between intent and transfer degrades lead quality. Vendors who cannot report median speed-to-lead under 5 minutes operate below modern infrastructure standards, which is why reducing speed-to-lead in outbound campaigns sits upstream of every other contact rate lever.
What the Contact Rate Gap Costs Per Year
For a debt settlement floor running $20,000 per month in transfer spend, the annual differential is the number that matters:
- At 9 percent contact rate: $1,776,000 annually spent producing accepted transfers
- At a 30 percent contact rate: $371,520 annually is spent producing accepted transfers
- Annual differential: $1,404,480 in lower acquisition cost, or the same spend producing far more transfers
Operators who evaluate vendors on hourly rate or per-transfer cost without contact rate analysis make decisions disconnected from revenue. Contact rate is the qualifying question. Pricing is secondary.
The Six Types of Live Transfers by Vertical
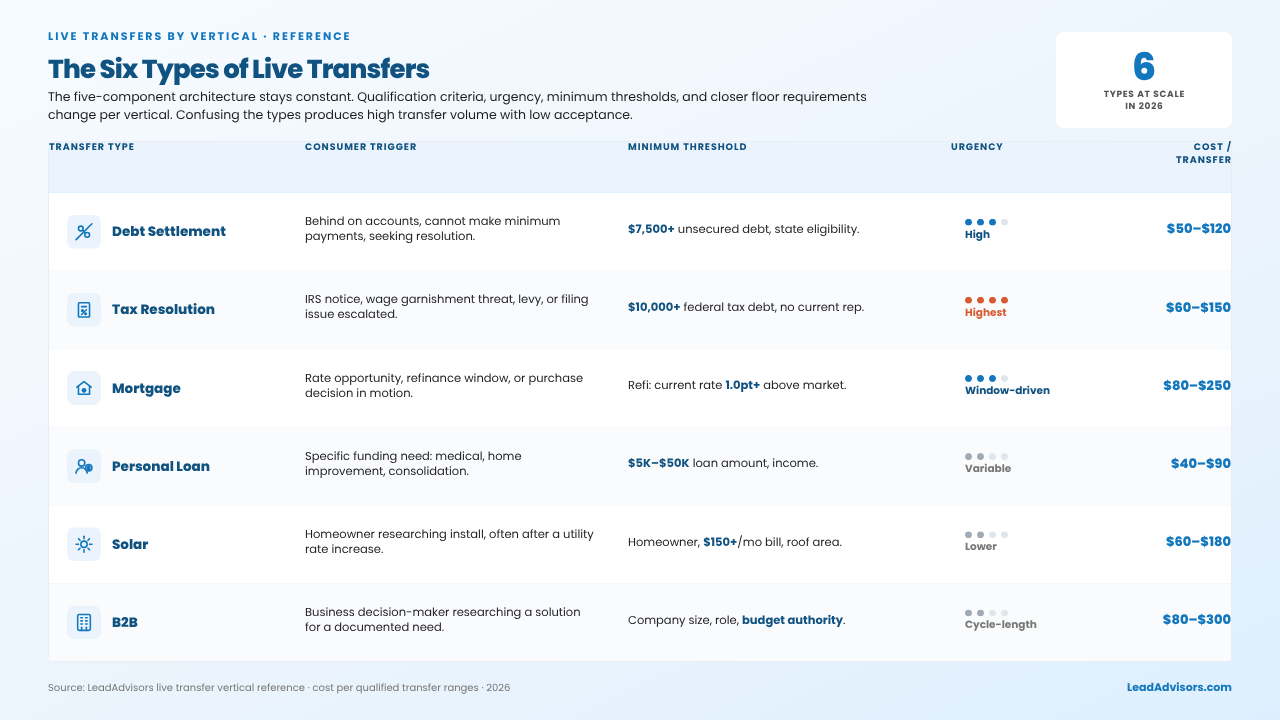
Six primary types of live transfers operate at scale in 2026: debt settlement, tax resolution, mortgage, personal loan, solar, and B2B. Each has different qualification criteria, different urgency profiles, different minimum thresholds, and different closer floor requirements. Confusing the types produces campaigns with high transfer volume and low acceptance rates.
What Stays Constant Across Types
The five-component campaign architecture stays consistent across every vertical:
- Lead source layer
- Pre-qualification layer
- Technology stack
- Compliance infrastructure
- Multi-channel warm-up
The vendor evaluation framework remains consistent as well: consent verification, criteria match rate, exclusivity, speed-to-transfer, and QA infrastructure apply to every vertical. What changes per vertical are the qualification criteria, the urgency profile, the minimum thresholds, and the closer-floor expectations?
Type 1: Debt Settlement Live Transfers
Consumer trigger: Cannot make minimum payments, behind on accounts, actively seeking debt resolution.
Minimum threshold: $7,500 to $10,000 in unsecured debt for most program economics.
Pre-qualification confirms: Total unsecured balance, payment status, and state eligibility.
State restrictions: Specific states limit or prohibit debt relief programs. Eligibility gets built into sourcing, not handled at the call.
Urgency profile: High. Consumer pain is active.
Typical buyer: Debt settlement floor, 15 to 80 closers, CEO or VP Sales. Budget $15K to $130K+ per month.
Cost-per-transfer range: $50 to $120 per qualified transfer.
Best fit for operations: Debt settlement firms with closers trained to handle active financial distress conversations. The debt settlement live transfer playbook covers the qualification thresholds and state restrictions in depth.
Type 2: Tax Resolution Live Transfers
Consumer trigger: IRS notice received, wage garnishment threat, levy, or filing issue that has already been escalated.
Minimum threshold: $10,000 in federal tax debt for most resolution program economics.
Pre-qualification confirms: Type of IRS issue (unpaid balance, unfiled returns, garnishment, levy, audit), amount owed, and current representation status. A prospect already working with a tax attorney or CPA is not a viable transfer.
Urgency profile: Highest of any financial vertical. IRS triggers create active urgency that converts faster on the floor.
Typical buyer: Tax resolution firm, CEO or VP Sales. Budget similar to debt settlement.
Cost-per-transfer range: $60 to $150 per qualified transfer.
Best fit for operations: Tax resolution firms with licensed CPAs or enrolled agents on the closer floor. The tax resolution live transfer guide breaks down IRS issue types and verification standards.
Type 3: Mortgage Live Transfers
Consumer trigger: Rate opportunity, refinance window, or purchase decision in motion.
Minimum threshold: Varies by loan type. Refinance economics typically require a current rate 1.0+ points above market.
Pre-qualification confirms: Loan purpose (purchase, refinance, cash-out), credit and income baseline, current loan status (rate, time remaining, fixed vs variable).
Urgency profile: Window-driven. Hot when rates shift, cold when they stabilize. Speed-to-connect is more predictive here than in any other vertical.
Typical buyer: Mortgage broker, loan officer team, lending operation. Budget structure varies widely.
Cost-per-transfer range: $80 to $250 per qualified transfer, depending on loan type and exclusivity.
Best fit for operations: Mortgage operations with licensed loan officers ready to take warm transfers during rate-window opportunities. The mortgage live transfer guide details loan-purpose qualification and rate-window timing.
Type 4: Personal Loan Live Transfers
Consumer trigger: A specific funding need, such as medical expenses, home improvement, debt consolidation, or a major purchase.
Minimum threshold: A $5,000-$50,000 loan amount is typical.
Pre-qualification confirms: Loan purpose, credit baseline, income verification willingness, and employment status.
Urgency profile: Variable by purpose. Medical and emergency funding converts faster than discretionary purposes.
Typical buyer: Personal loan originators, fintech lenders, consolidation specialists.
Cost-per-transfer range: $40 to $90 per qualified transfer.
Best fit for operations: Direct lenders or brokers with fast underwriting decisions.
Type 5: Solar Live Transfers
Consumer trigger: Homeowner researching solar installation, often triggered by a rate increase or environmental motivation.
Minimum threshold: Homeowner status, sufficient roof area, sufficient electric bill ($150+ per month typical).
Pre-qualification confirms: Homeownership, electric bill range, roof condition, and decision-maker status.
Urgency profile: Lower than financial verticals. Longer consideration cycles.
Typical buyer: Solar installers, dealer networks, EPC operations.
Cost-per-transfer range: $60 to $180 per qualified transfer, depending on geography and exclusivity.
Best fit for operations: Solar dealers with in-home consultation capacity ready to schedule from the warm transfer.
Type 6: B2B Live Transfers
Consumer trigger: Business decision-maker researching a solution for a documented business need.
Minimum threshold: Company size, role, vertical fit, and defined budget authority.
Pre-qualification confirms the following: Company size, decision-maker role, current solution status, defined pain point, and timeline.
Urgency profile: Cycle-length dependent. B2B cycles run longer than consumer verticals.
Typical buyer: SaaS sales operations, professional services firms, B2B service providers.
Cost-per-transfer range: $80 to $300 per qualified transfer, depending on ICP specificity and exclusivity.
Best fit for operations: B2B sales teams with defined ICPs and closers experienced in committee-based buying cycles.
Which Type Fits Which Operator Profile
For a sales-floor owner running a debt-settlement, tax, or mortgage operation, vertical-specific financial transfers are a natural fit. High-volume, vertical-specific, qualification-driven.
For an ops builder at a $5M to $30M service operation, mortgage, personal loan, or B2B transfers fit operations with a defined sales infrastructure but variable lead flow.
For operators feeding inbound ad or mailer responses into a transfer model, the vertical depends on the underlying campaign. Match the transfer type to the existing customer profile. Do not pivot to a new vertical mid-campaign.
Merchant cash advance operations run a seventh variant with its own qualification logic around monthly revenue and time in business, close enough to the financial verticals to use the same architecture but distinct enough to warrant its own merchant cash advance live transfer approach.
Operators running transfer campaigns across multiple verticals should maintain separate pre-qualification scripts, compliance documentation, and QA standards for each vertical. Cross-vertical contamination produces transfer quality drops that show up on the closer floor.
How a Live Transfer Campaign Actually Works at the Structural Level
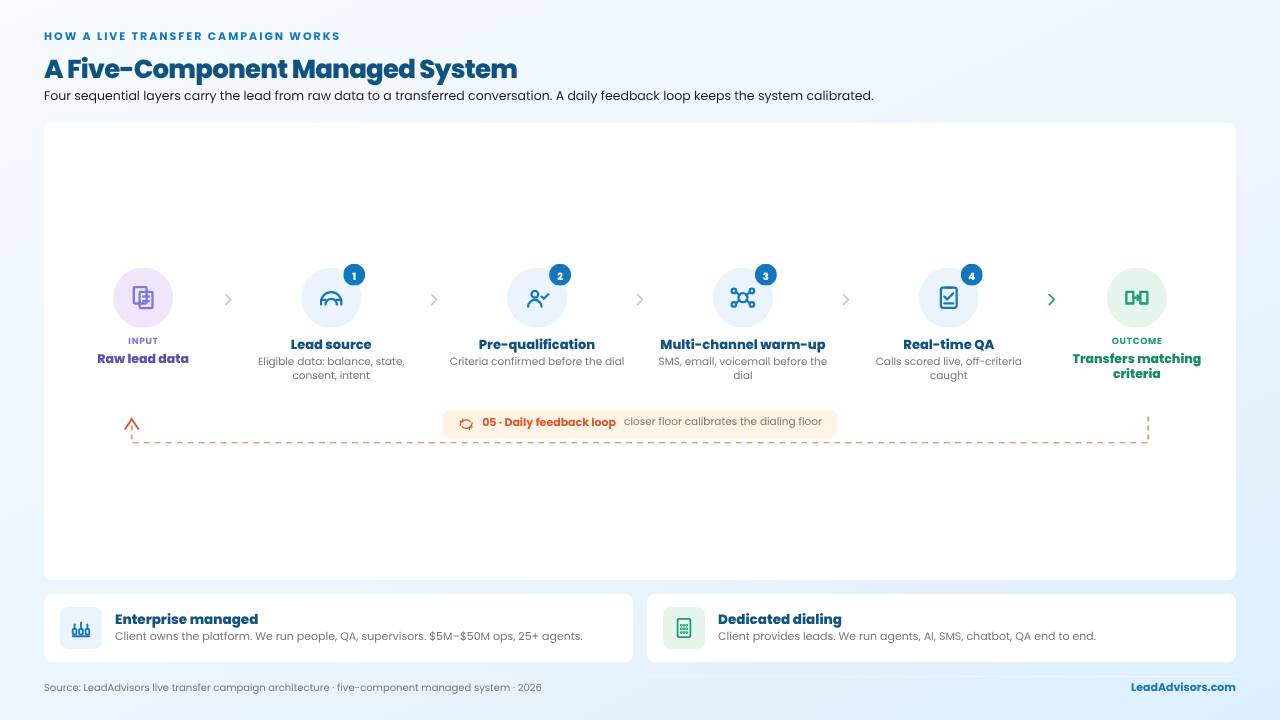
A live transfer campaign is not a call center routing transfers to a sales floor. It is a five-component managed system that converts raw lead data into transferred conversations that match documented criteria.
Component 1: Lead Source Layer
What it does: Sources prospect data that meets vertical-specific eligibility criteria such as minimum balance thresholds, state eligibility, TCPA consent chain, and intent signals.
What separates the strong from the weak: strong lead sources document the consent chain explicitly. Weak lead sources cannot show a timestamp, opt-in language, or source.
Why it matters: Bad data in a campaign leads to a low contact rate and high transfer rejection, regardless of the downstream components.
Component 2: Pre-Qualification Layer
What it does: Confirms transfer criteria before the live dial reaches the closer floor. Agents verify minimum balance, intent signals, state eligibility, and the prospect’s ability to engage.
What separates strong from weak: Strong pre-qualification confirms three specific criteria per vertical. Weak pre-qualification asks general interest questions.
Why it matters: Pre-qualification standards determine the transfer acceptance rate on the closer floor, and a clean outbound call disposition taxonomy for tracking transfer quality makes the failure points visible.
Component 3: Multi-Channel Warm-Up Layer
What it does: Touches prospects via SMS, email, and voicemail before the live dial. Multi-touch sequences increase live answer rates 38 to 48 percent over single-channel cold dialing.
What separates strong from weak: Strong warm-up runs structured sequences across phone, SMS, email, and chat. Weak warm-up runs phone-only.
Why it matters: Phone-only operations cap contact rate at 12 to 18 percent. Multi-channel orchestration breaks 30 percent, and the full multi-channel contact rate optimization sequence lays out the cadence to get there.
Component 4: Real-Time QA Layer
What it does: Monitors and scores calls as they happen. Transfers that do not meet the criteria get caught before reaching the sales floor.
What separates strong from weak: Strong QA covers 95 to 100 percent of calls via AI-assisted QA. Weak QA manually covers 2 to 5 percent of calls.
Why it matters: QA coverage determines transfer quality at scale. Manual-only QA cannot scale past 20 agents without quality degradation.
Component 5: Feedback Loop Layer
What it does: Daily communication between the dialing team and the closer floor. If closers report weak intent, the pre-qualification script gets updated. If a lead source is producing rejections, it gets pulled.
What separates strong from weak: Strong feedback loops operate daily. Weak feedback loops operate monthly during business reviews.
Why it matters: Campaigns calibrate or decay based on feedback loop cadence.
The Two Campaign Models LeadAdvisors Runs
Enterprise Managed Campaigns. The client owns the platform (CRM, dialer, training, scripts). LeadAdvisors provides people, supervisors, QA, and management infrastructure. Best fit for $5M to $50M operations with 25+ agent needs and existing sales infrastructure.
Dedicated Dialing for Contact Strategy. The client provides leads. LeadAdvisors manages everything: agents, AI automation, SMS, chatbot, drip sequences, QA, and supervisors. Best fit for operations with lead flow but no dialing floor infrastructure.
Five components, two campaign models. The architecture determines whether the campaign produces a 9 percent contact rate or a 30 percent contact rate.
The Five Components Every Live Transfer Campaign Needs Before Launch
Five components must be in place before a live transfer campaign goes live. Campaigns that skip any of them produce high rejection rates, legal exposure, or both.
Component 1: Lead Source Quality and Criteria Alignment
What needs to be in place:
- Minimum balance thresholds documented per vertical (debt $7,500+, tax $10,000+, mortgage by loan type)
- State eligibility filters are built into sourcing, not into the call
- TCPA-compliant consent chain with documented opt-in source, timestamp, and language shown to the consumer
Why it matters: Bad data caps every downstream metric. No script or QA can fix a poor lead list.
Component 2: Pre-Qualification Script and Transfer Criteria
What needs to be in place:
- Three specific qualifying criteria documented per vertical
- Soft transfer vs hard transfer rules defined
- Closer floor receives confirmation of qualification before the call lands
Why it matters: Pre-qualification standards determine acceptance rate on the closer floor, but acceptance also depends on training closers to receive warm transfers without dropping conversion.
Component 3: Technology Stack
What needs to be in place:
- Predictive or power dialer configured for lead type and call volume
- CRM integration records transfer data, notes, and outcomes in real time
- Call recording with searchable archive for QA and dispute review
- Receiving sales floor technology confirmed compatible (routing, transfer capacity, queuing)
Why it matters: Technology gaps surface mid-campaign when fixing them is expensive.
Component 4: Compliance Infrastructure
What needs to be in place:
- TCPA consent chain documented for every transferred lead with source, timestamp, and opt-in language
- DNC list scrubbing on a scheduled meeting, federal rules (minimum every 31 days, real-time preferred)
- State-specific call recording disclosure handled in the opening of the call (two-party consent states include California, Florida, and Illinois, among others)
- January 2025 FCC one-to-one consent rule infrastructure for any campaign sourcing leads via lead generators
Why it matters: TCPA exposure is the largest legal risk in outbound dialing, and class-action exposure scales with the volume of non-compliant transfers. Building a TCPA compliance framework for outbound calling campaigns before launch is cheaper than defending a complaint after.
Component 5: Multi-Channel Warm-Up Sequence
What needs to be in place:
- SMS pre-touch infrastructure with documented consent
- Email confirmation sequence
- Voicemail drop integration is compliant
- Chat AI follow-up where applicable
Why it matters: Multi-channel warm-up is the difference between a 12 percent contact rate and a 30 percent contact rate. It is not optional infrastructure at modern operator standards.
The Pre-Launch Checklist
Before any transfer campaign goes live, the operator should confirm:
- Lead source documented with consent chain
- Pre-qualification script with three vertical-specific criteria
- Technology stack tested ,end-to-end including closer floor receiving
- Compliance documentation reviewed by counsel, where applicable
- Multi-channel warm-up sequences are configured and active
Campaigns launching without all five components in place produce predictable underperformance. The diagnostic is structural, not vendor-specific.
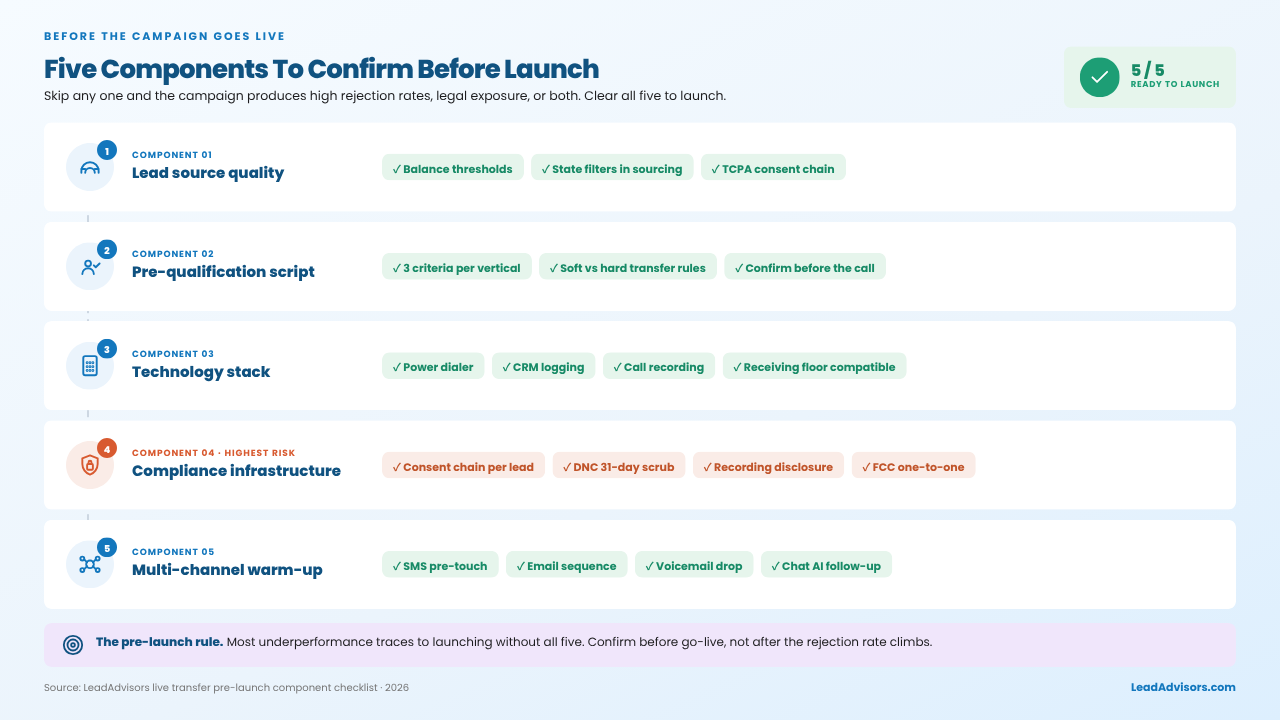
Most underperforming campaigns trace back to launching without one or more components in place. Pre-launch checklists prevent most of the post-launch problems.
How to Identify the Best Live Transfer Companies: The Five-Gate Evaluation Framework
The best live transfer companies pass five specific evaluation gates. Vendors who cannot pass all five should not handle outbound dialing volume regardless of how aggressive their pricing looks.
The five gates separate operator-led BPO from call centers pointed at lead lists. Apply them in order during vendor evaluation. Each gate has explicit pass and fail criteria.
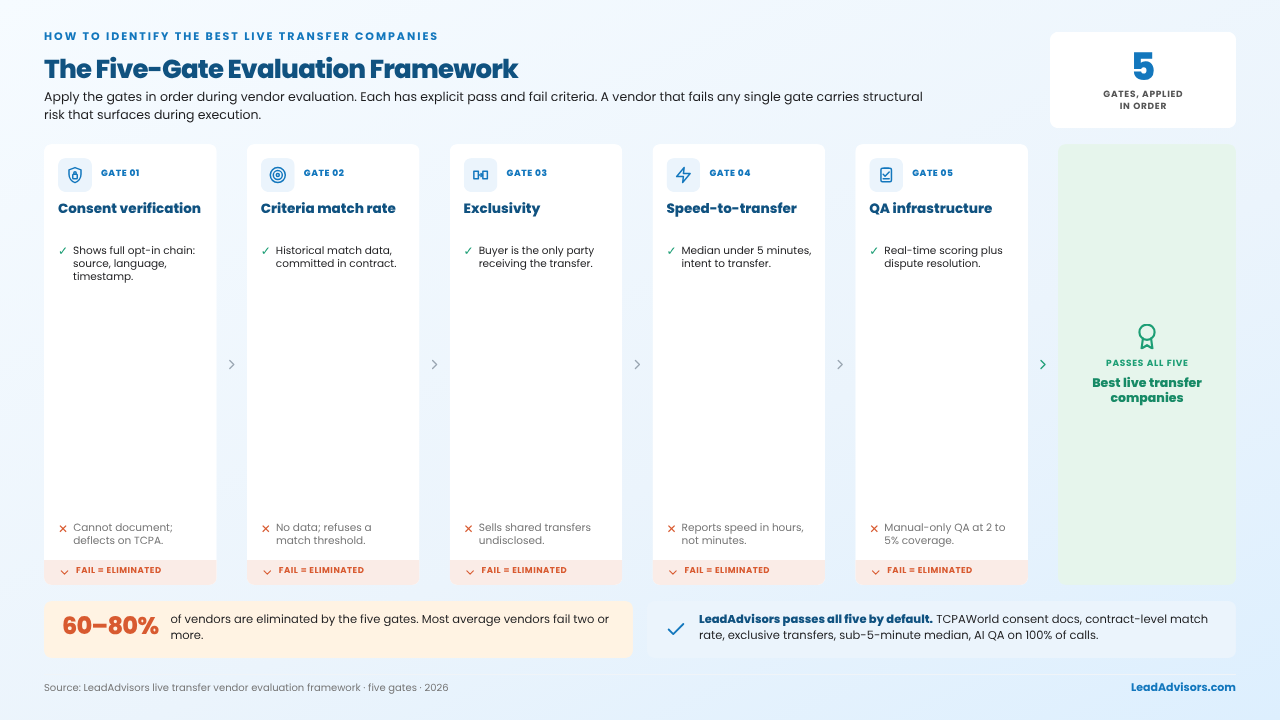
Gate 1: Consent Verification
Pass criteria: Vendor can provide the full opt-in chain for any transferred lead upon request, including the original source, the consent language shown to the consumer, and the timestamp.
Fail criteria: Vendor cannot document the consent chain, deflects on TCPA questions, or claims “industry standard” without specifics.
Why this gate matters first: TCPA exposure passes from vendor to buyer if the vendor cannot document consent. Class-action liability follows the volume.
Gate 2: Transfer Criteria Match Rate
Pass criteria: Vendor provides past transfer criteria match rate data in the relevant vertical and will write a match rate expectation into the contract or adjust pricing to reflect the risk.
Fail criteria: Vendor cannot provide historical match rate data or refuses to commit to a match rate threshold.
Why this gate matters: Match rate determines what the buyer actually pays per usable transfer. It also exposes how a vendor handles aged data, since working aged leads with live dialers demands a different qualification standard than fresh intent.
Gate 3: Exclusivity
Pass criteria: Vendor confirms transfers are not sold to multiple buyers simultaneously. The buyer is the only party receiving the transfer in real time.
Fail criteria: Vendor sells shared transfers without disclosing the shared structure, or sells exclusivity at upsell pricing without proof.
Why this gate matters: Shared transfers produce lower close rates and consumer confusion. The closer floor receives a prospect who has been pitched by another company in the last hour.
Gate 4: Real-Time Speed-to-Transfer
Pass criteria: Vendor provides a median speed-to-transfer metric, with the median under 5 minutes from intent expression to live transfer attempt.
Fail criteria: Vendor cannot provide median speed-to-transfer or reports speed in hours instead of minutes.
Why this gate matters: Every hour between intent and transfer degrades lead quality. Speed-to-transfer is the most predictive metric in outbound contact, and the conversion data behind why speed-to-lead under five minutes determines close rate is why the threshold is non-negotiable.
Gate 5: QA Infrastructure
Pass criteria: Vendor monitors calls in real time, has a documented scoring system, and has a clear process for submitting and resolving transfer disputes.
Fail criteria: Vendor cannot describe the QA process specifically, runs manual-only QA at 2 to 5 percent coverage, or has no dispute resolution mechanism.
Why this gate matters: QA infrastructure determines whether transfer quality holds at scale. Manual-only QA cannot scale past 20 agents.
What Separates Best Live Transfer Companies From Average Vendors
The best live transfer companies operate as managed campaigns rather than lead resellers. They run the full five-component architecture, document compliance with TCPAWorld standards, commit to criteria-match rates contractually, maintain exclusivity, operate with a 5-minute median speed-to-transfer, and run AI-assisted QA on 95 to 100 percent of calls.
Average vendors fail at least one of the five gates. Most fail two or more.
How LeadAdvisors Operates Against the Five Gates
LeadAdvisors campaigns pass all five gates by default:
- TCPAWorld-compliant consent chain documentation
- Documented criteria match rate by vertical with contract-level commitment
- Exclusive transfers, not shared
- Speed-to-connect under 5 minutes median
- AI-assisted QA on 100 percent of calls
Operators applying the five-gate framework during vendor evaluation eliminate 60 to 80 percent of vendors from consideration. The remaining vendors are typically worth contract negotiation.
The Five Metrics That Show If a Campaign Is Actually Working
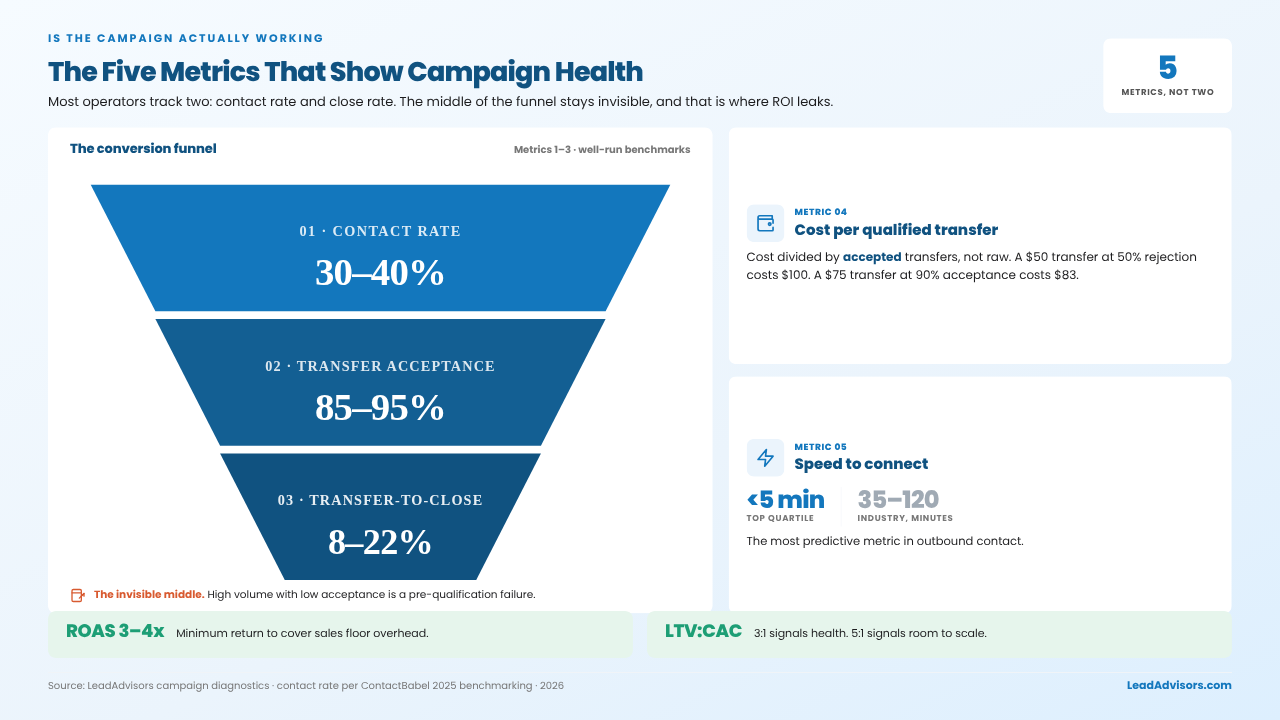
Five metrics determine whether a live transfer campaign is actually working. Most operators track two. The middle of the funnel stays invisible without the other three.
Metric 1: Contact Rate
What it measures: Percentage of dialed prospects reached for a meaningful conversation.
Benchmark:
- Industry typical: 7 to 14 percent (per ContactBabel 2025 US Contact Center benchmarking)
- Well-run operations: 22 to 38 percent
- Operator-led BPO with multi-channel: 30 to 40 percent
What it signals: Lead source quality and warm-up effectiveness. Below 20 percent on debt settlement campaigns, either list quality or the warm-up sequence needs to be rebuilt.
Metric 2: Transfer Acceptance Rate
What it measures: Percentage of transfers sent to the closer floor that are accepted as meeting criteria.
Benchmark at well-run operations: 85 to 95 percent acceptance.
What it signals: Pre-qualification standards strength. High transfer volume with a low acceptance rate is a pre-qualification failure, not a success, which is why grading live transfer leads by qualification stage protects closer effort over time.
Metric 3: Transfer-to-Close Rate
What it measures: Percentage of accepted transfers that convert to closed deals.
Benchmark varies by vertical:
- Debt settlement: 8 to 18 percent
- Tax resolution: 12 to 22 percent
- Mortgage refinance during favorable windows: 6 to 14 percent
What it signals: Transfer quality and closer floor execution. Track it separately from the overall close rate so the transfer channel’s contribution can be measured independently.
Metric 4: Cost Per Qualified Transfer
What it measures: Total campaign cost divided by accepted transfers, not raw transfers.
Why this matters more than cost per transfer: A campaign with $50 cost per raw transfer but a 50 percent rejection rate has a $100 cost per qualified transfer. A campaign with a $75 cost per raw transfer but a 90 percent acceptance rate has an $83 cost per qualified transfer. The higher-rate campaign produces better unit economics despite the higher headline number.
Metric 5: Speed to Connect
What it measures: Time from lead submission to live agent conversation.
Benchmark:
- Industry typical: 35 to 120 minutes
- Well-run operations: 5 to 15 minutes
- Top-quartile operations: under 5 minutes
What it signals: Lead routing infrastructure and on-call agent capacity. It is the most predictive metric in outbound contact. Campaigns that actively manage speed-to-connect hold a real advantage in conversion rate.
Profitability Layer Metrics for Owner-Level Decisions
ROAS (Return on Ad Spend): Total revenue from transfers divided by total campaign cost. Target a minimum 3 to 4x return to cover sales floor overhead.
LTV to CAC Ratio: Lifetime Value to Customer Acquisition Cost. A 3:1 ratio signals health. A 5:1 ratio signals room to scale the budget aggressively. Both sit inside the broader set of call center metrics that predict campaign profitability.
Tracking only cost per transfer and close rate produces invisible middle-of-the-funnel decisions. The five metrics together produce the diagnostic clarity that drives campaign improvement.
Scaling Live Transfer Campaigns Without Losing Quality
Live transfer campaigns lose quality at scale when the management layer does not grow with the agent count. Most quality drops happen between 20 and 50 agents.
What Breaks at Scale
QA coverage degrades. A single QA monitor reviewing real-time calls covers 100 percent of a 10-agent campaign. The same monitor covers 5 percent of a 50-agent campaign. Transfer quality variance increases as coverage drops.
Supervisor-to-agent ratios stretch. Ratios above 1:20 result in measurable declines in agent performance and compliance with transfer criteria. Most operations push ratios beyond 1:20 when scaling without accounting for the quality cost.
Feedback loops slow. Daily feedback cadence becomes weekly. Weekly becomes monthly. Calibration loops that operated at 24-hour cycles at 10 agents operate at week-long cycles at 50 agents.
What Quality Management at Scale Requires
Holding transfer quality at volume is what the QA and compliance infrastructure for outbound campaigns is built to do. QA infrastructure at 20 to 30 agents:
- One dedicated QA monitor per 10 to 12 agents
- AI-assisted QA on 95 to 100 percent of calls
- Daily QA scoring with individual agent feedback before the next shift
- Weekly QA reporting to the operator’s sales floor management
Supervisor-to-agent ratios:
- Standard at 1:12 to 1:15
- Beyond 1:20 produces measurable performance drops
Feedback loop cadence:
- Daily between dialing floor and closer floor at any scale past pilot
- Lead source performance review weekly minimum
- Pre-qualification script refinement triggered by closer feedback within 48 hours
Build In-House or Buy Managed Infrastructure
Build in-house when the operation already has QA capability, supervisor depth, and infrastructure across campaigns. The marginal cost of adding management capacity is lower than buying it. Buy managed infrastructure when that capacity is not built. Building it takes 6 to 9 months. Buying it adds capacity in 30 to 60 days.
LeadAdvisors enterprise-managed campaigns are built for scale operations: 1,000-seat capacity, QA infrastructure included, and supervisor coverage built into the campaign cost. Operators planning to grow beyond 30 agents should confirm whether their management layer can keep up before they scale, not after, since most methods to improve call center performance at scale come down to management ratios rather than agent effort.
Campaign quality drops at scale are predictable and preventable. Management layer investment must precede agent count growth, not follow it.
Frequently Asked Questions About Live Transfers
What Are Live Transfers?
Live transfers are real-time qualified prospect handoffs where a call center agent pre-qualifies a consumer’s interest, confirms eligibility criteria, and transfers the live conversation directly to a closer or sales representative. Unlike standard leads delivered as form data, live transfers are active conversations where the prospect has already expressed intent and met documented criteria before reaching the closing floor. The model works for debt settlement, tax resolution, mortgage, personal loan, solar, and B2B verticals.
What Are the Different Types of Live Transfers?
Six primary types of live transfers operate at scale: debt settlement, tax resolution, mortgage, personal loan, solar, and B2B. Each has different qualification criteria, urgency profiles, and minimum thresholds. Debt settlement transfers require $7,500+ unsecured debt and state eligibility. Tax resolution transfers require $10,000+ federal tax debt with a verified IRS issue type. Mortgage transfers require confirmation of credit baseline, income, and loan purpose. The pre-qualification script varies by vertical, even though the campaign architecture remains consistent.
How Do You Identify the Best Live Transfer Companies?
The best live transfer companies pass five specific evaluation gates: consent verification (full opt-in chain documentation including source, language, and timestamp), transfer criteria match rate (with contract-level commitment), exclusivity (not shared with other buyers in real time), real-time speed-to-transfer (median under 5 minutes), and QA infrastructure (real-time monitoring on 95 to 100 percent of calls, documented scoring, and a dispute resolution process). Vendors failing any of the five gates produce structural risk that materializes during campaign execution.
What Is a Good Contact Rate for Live Transfer Campaigns?
A good live transfer campaign contact rate runs 25 to 40 percent at operator-led BPO with multi-channel infrastructure. Industry typical operations produce 5 to 12 percent. The gap comes from three factors: multi-channel orchestration (phone, SMS, email, and chat) instead of phone-only outbound, speed-to-lead infrastructure under 5 minutes, and list intelligence, including time-of-day optimization and TCPA-compliant cadence patterns. Operators should treat the contact rate as the qualifying question when evaluating vendors.
How Much Do Live Transfer Leads Cost?
Live transfer pricing varies by vertical, quality standards, and exclusivity, and the economics of live transfer hinge on cost per accepted transfer rather than headline per-transfer price. Debt settlement transfers run $50 to $120 per qualified transfer. Tax resolution transfers run $60 to $150. Mortgage transfers run $80 to $250, depending on loan type and exclusivity. Personal loan transfers run $40 to $90. Solar transfers run $60 to $180. B2B transfers run $80 to $300. The metric that matters more than per-transfer cost is cost per accepted transfer, adjusted for closer floor rejection rate.
How Do Live Transfers Work?
Live transfers work through a five-component campaign architecture: lead source layer (sources prospect data meeting eligibility criteria), pre-qualification layer (confirms transfer criteria before the live dial), multi-channel warm-up (SMS, email, and voicemail touches before the phone dial), real-time QA layer (monitors and scores calls as they happen), and feedback loops (daily calibration between dialing floor and closer floor). The architecture turns raw lead data into transferred conversations matching documented criteria.
Why Is My Live Transfer Campaign Underperforming?
Underperforming live transfer campaigns trace to one of five structural causes: lead source quality (bad data caps all downstream metrics), pre-qualification standards (loose criteria produce high transfer volume with low acceptance), multi-channel infrastructure gaps (phone-only operations cap at 12 to 18 percent contact rate), QA coverage shortfalls (manual-only QA at 2 to 5 percent coverage cannot maintain quality past 20 agents), or feedback loop failures (slow calibration between dialing floor and closer floor). The diagnostic identifies which structural cause drives the underperformance.
Live Transfer Campaigns Come Down to Three Layers
Live transfer campaigns produce 5 to 12 percent contact rates at industry typical and 25 to 40 percent at operator-led BPO. The gap determines ROI. The setup determines the gap.
Three layers carry the outcome: types, architecture, and vendor evaluation. Six types of live transfers operate at scale, each with vertical-specific qualification but the same five-component architecture. The best live transfer companies pass all five evaluation gates.
Vertical changes the qualification criteria but not the architecture. Debt settlement, tax resolution, mortgage, personal loan, solar, and B2B each require vertical-specific pre-qualification. The architecture stays consistent.
The campaigns that produce ROI matched the type to the operation, built the architecture before launch, and evaluated vendors against the five gates. The campaigns that produce activity reports without conversion skipped one or more of the three.
Type, architecture, and vendor. Get all three right before launch.