Debt relief and financial services operators running outbound campaigns face a shared structural problem: the gap between leads purchased and leads actually reached. If your team contacted 120 out of 1,000 leads, the other 880 went cold within hours. Not because the list was bad. Because nothing in your operation was built to reach them. That gap is where most outbound revenue gets lost, and it compounds with every new lead purchase that goes into the same broken infrastructure.
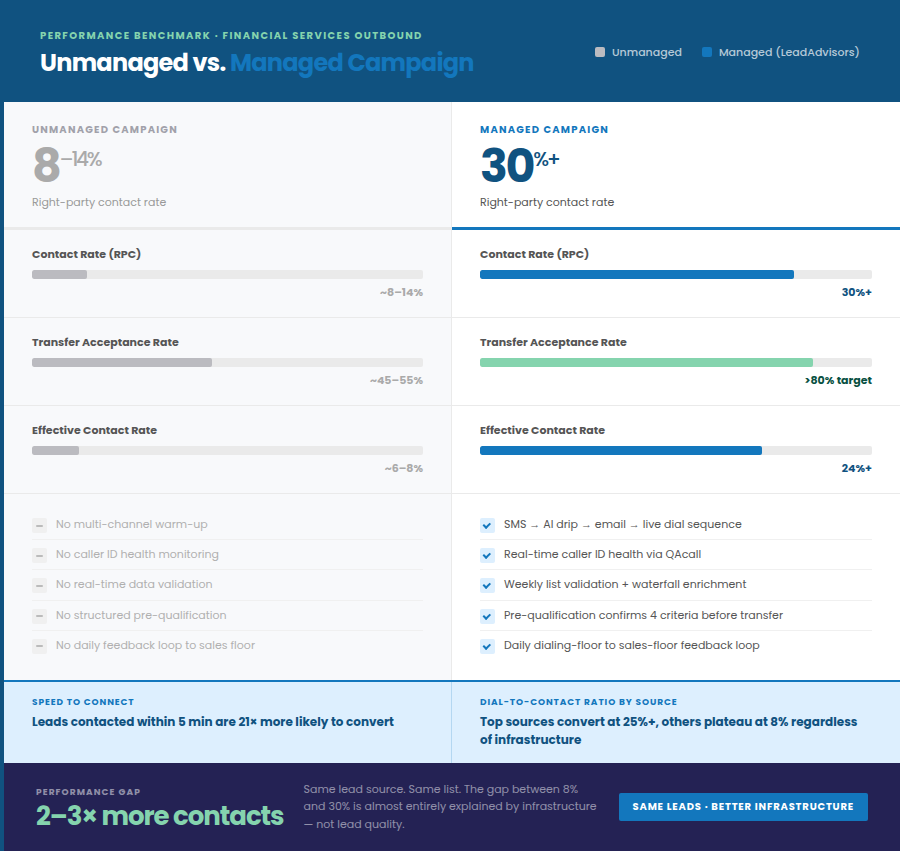
This is not a dialer setting or a script problem. It is an infrastructure problem. The average unmanaged campaign in financial services reaches eight to 14 percent of purchased leads. Managed multi-channel campaigns running full contact rate optimization on the same lead sources consistently reach 30 percent and above.
The difference is not the list. It is everything built around the list, from live transfer leads qualification to caller ID health to the warm-up sequence that determines whether a prospect answers at all. For operators working specifically in debt live transfer campaigns, these infrastructure gaps are especially costly.
This article covers what that infrastructure actually requires, from lead data and caller ID reputation to multi-channel warm-up, pre-qualification, and QA, and where each one breaks down in a typical outbound operation.
If your contact rate is below 20 percent, this article is for you.

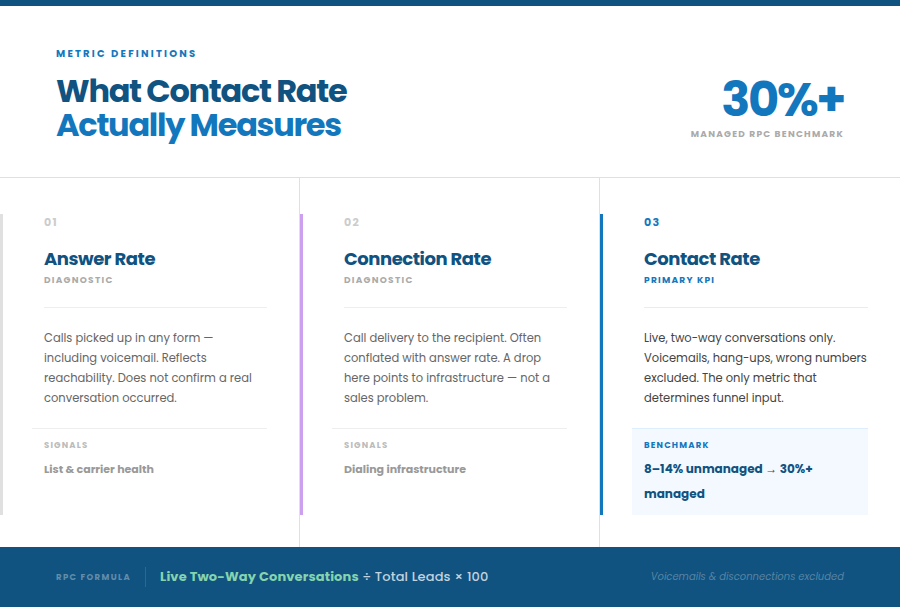
What Contact Rate Actually Measures and What It Does Not
A significant amount of confusion exists in how these metrics are tracked. Three terms are regularly conflated, and treating them as equivalent is where many diagnostic errors begin.
- Answer rate is the percentage of outbound calls that are picked up in any form, including voicemail. It reflects reachability. It does not indicate whether a real conversation took place.
- Connection rate is often used interchangeably with answer rate. It measures delivery. An early drop in connection rate typically signals a dialing infrastructure problem, not a sales problem.
- Contact rate is the percentage of leads that result in a meaningful, live, two-way conversation. Voicemails, quick hang-ups, wrong numbers, and disconnections are excluded. This is the metric that determines whether the funnel has anything to work with.
Live Two-Way Conversations / Total Leads x 100 = Contact Rate
Two campaigns can share the same answer rate while producing completely different contact rates. The difference is determined by pre-qualification quality, warm-up sequence, and what happens in the first ten seconds of the call. Teams that track both answer rate and contact rate together are far better positioned to identify exactly where calls are breaking down rather than guessing from fragmented reports.
Metric Comparison Table
| Metric | What it Matters | Benchmark | Status |
| Answer Rate | Pickup in any form, including voicemail | Varies widely | Diagnostic |
| Connection Rate | Call delivered to the recipient | Varies widely | Diagnostic |
| Contact Rate (RPC) | Live two-way conversation confirmed | 8-14% unmanaged, 30%+ managed | Primary KPI |
| Transfer Acceptance Rate | % of transfers accepted by closers | Greater than 80% is the target | Secondary KPI |
The 5 Root Causes of Low Contact Rate
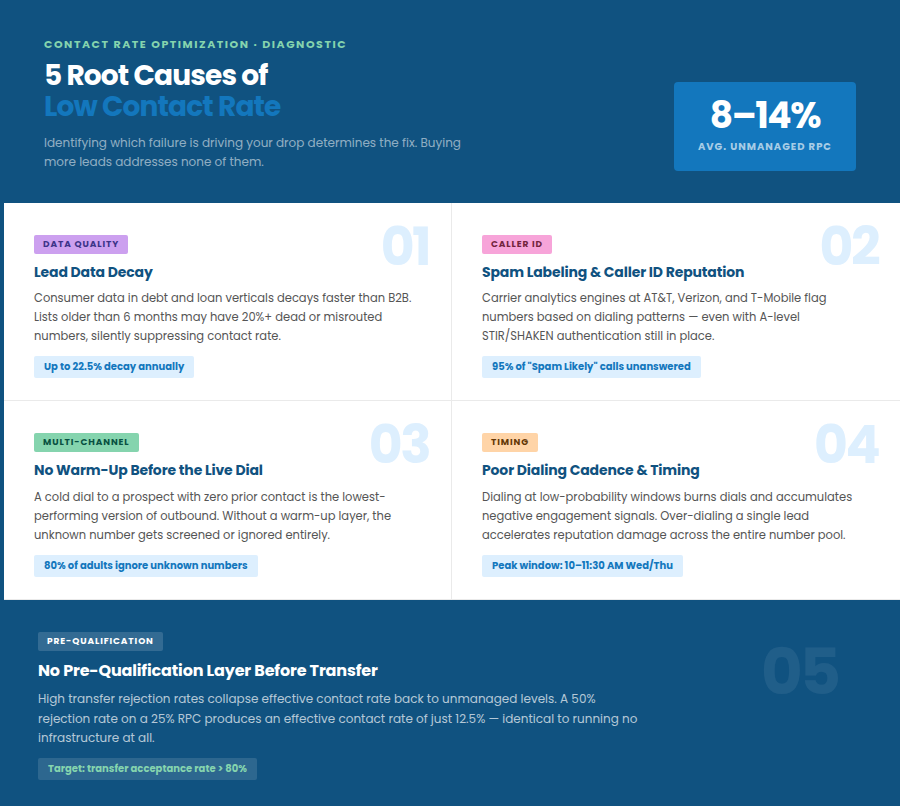
Contact rate problems almost always originate from one or more of five sources. Identifying which one is causing the drop determines which fix to prioritize. Most operators attempt to solve all five simultaneously by purchasing more leads, which compounds the problem rather than correcting it.
1. Lead Data Decay
Consumer data in financial services does not stay fresh. B2B data has been documented to decay at approximately 2.1 percent per month, around 22.5 percent annually, and consumer data in debt and loan verticals decays faster still.
A lead list that has not been validated in six months may contain 20 percent or more dead or misrouted numbers. Every dial to a disconnected line wastes agent time, degrades caller ID reputation, and suppresses contact rate without producing any visible signal that the list itself is the problem.
Mobile numbers, which are the primary reachability channel for consumer financial services, decay at five to ten percent annually. For debt settlement and loan operators, mobile-first sourcing and monthly data refreshes at a minimum are the operational standard, not an optional enhancement.
Operator Note: Upgrading the dialer while running stale data is an optimization in the wrong direction. Most contact rate problems that look like dialer failures are list problems when the data is actually examined.
2. Caller ID Reputation and Spam Labeling
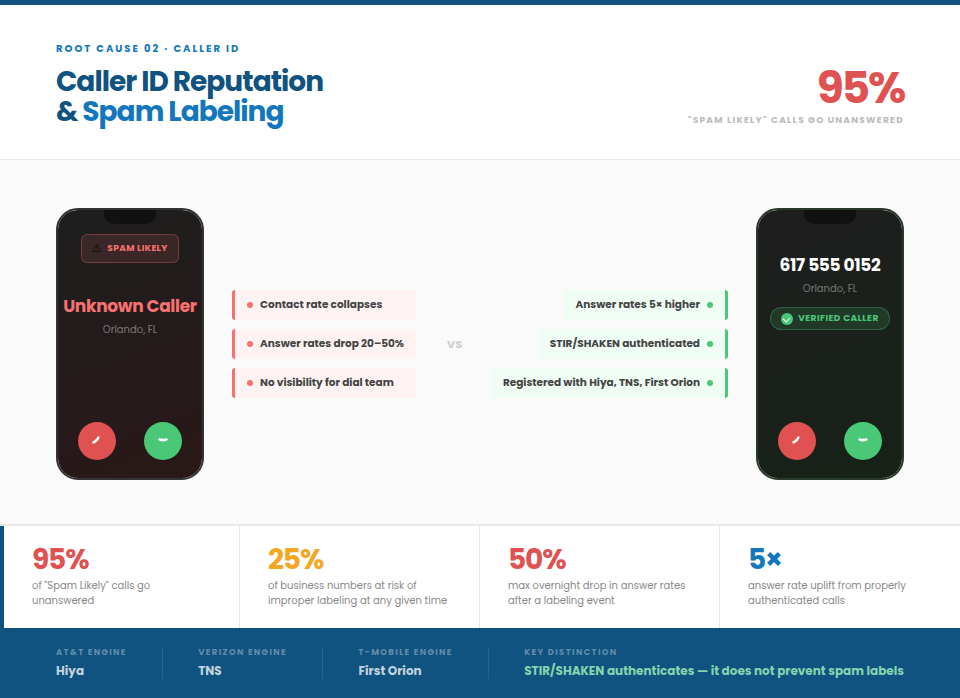
When outbound numbers are flagged as spam by carriers, contact rate drops immediately, even on high-intent, verified leads. The call goes out. The prospect’s phone rings. But the screen shows “Spam Likely,” or the call is silenced before the prospect sees it. The dialing team has no visibility into this until the contact rate has already fallen.
95 percent of calls labeled “Spam Likely” go unanswered. One provider study found that properly authenticated calls can see answer rates jump five times by comparison.
The STIR/SHAKEN framework, mandated by the FCC, authenticates whether a call is real, but it does not prevent spam labels. Labels are driven by analytics engines at AT&T (Hiya), Verizon (TNS), and T-Mobile (First Orion), each running its own proprietary algorithm. A number can be technically clean in one carrier’s system while flagged in another.
AI-driven carrier filtering from Verizon, T-Mobile, and AT&T has become significantly more aggressive heading into 2026. An average of 25 percent of a business’s phone numbers are at risk for improper call labeling at any given time. Answer rates can drop 20 to 50 percent overnight following a labeling event, with no script change, no list change, and no agent performance decline.
3. No Multi-Channel Warm-Up Before the Live Dial
A cold dial to a prospect who has had zero prior contact is the lowest-performing version of outbound. The prospect has no context for the call, a lower likelihood of answering an unknown number, and a lower intent to engage even if they do pick up.
A prospect who received an SMS the previous day, confirmed interest through that touchpoint, and recognizes the brand when the call appears is a materially different conversation: shorter, more focused, and with a significantly higher conversion likelihood. The warm-up layer is what separates managed campaigns from basic dialing operations, and it is the single highest-impact structural fix for contact rate in a financial services campaign.
4. Poor Dialing Cadence and Timing
Call answer rates peak between 10 AM and 11:30 AM local time. Wednesday and Thursday have been identified as the strongest days for live contact and lead qualification, a finding consistent across the MIT Lead Response Management Study and more recent 2025 to 2026 benchmark reports. Campaigns that dial at low-probability windows burn dials, accumulate negative engagement signals, and erode caller ID health over time.
Over-dialing a single lead also degrades the contact rate. Capping at two attempts per prospect per day, with six to eight total attempts across two to three weeks, is the documented operational standard for financial services outbound. Beyond this threshold, additional dials produce diminishing returns and accelerate reputation damage.
5. No Pre-Qualification Layer Before Transfer
High transfer rejection rates are a structural outcome of routing prospects to closers before they have been properly screened. Without a pre-qualification layer, agents send transfers that do not meet criteria, that are not ready to engage, or that have already gone cold. This inflates transfer rejection rates, wastes closer time, and creates a false ceiling on what the dialing floor can produce.
A 50 percent rejection rate on a 25 percent dialing contact rate produces an effective contact rate of just 12.5 percent, the same range as an unmanaged campaign, despite significantly higher raw activity. The pre-qualification layer is what converts dialing volume into usable transfer volume.
Fix 1: Lead Data and List Hygiene
The contact rate ceiling is set by the list before the first dial is placed. No dialing infrastructure improvement can compensate for a list that is 20 percent or more dead on arrival.
- Validation frequency: Weekly refresh is the current standard for high-volume financial services campaigns. Monthly is the minimum. Lists older than six months should be treated as degraded until re-validated.
- Mobile-first sourcing: Personal phones are where financial services prospects are reachable in a hybrid-work environment. Office direct dials increasingly reach empty desks or forwarded voicemail systems.
- Waterfall enrichment: Sequentially validating numbers across multiple data providers has been shown to produce 30 to 50 percent improvements in connect rate. No single provider has complete or current consumer data across all regions and demographics.
- TCPA consent chain verification: Bad consent data means unworkable leads regardless of dialer quality. Consent documentation must be current and retrievable before any dial attempt is made.
- DNC scrubbing cadence: The federal minimum is every 31 days. Real-time scrubbing is the operational standard for campaigns with high dialing volume in regulated verticals like debt settlement and mortgage.
Quick Win: The fastest single fix for a degraded contact rate is list hygiene. Refreshing and validating contact data removes dead numbers from the dialing pool and reduces wasted dials immediately, before any technology changes are required.
Fix 2: Caller ID Reputation Management
Prevention is materially cheaper than remediation. Once numbers are flagged, the damage to the contact rate compounds before most operators become aware that it is happening.
Personalized outreach is now essential to avoid being filtered as spam, and caller ID reputation management has become mission-critical infrastructure for any compliant outbound operation.
How Carrier Spam Labeling Works in 2026
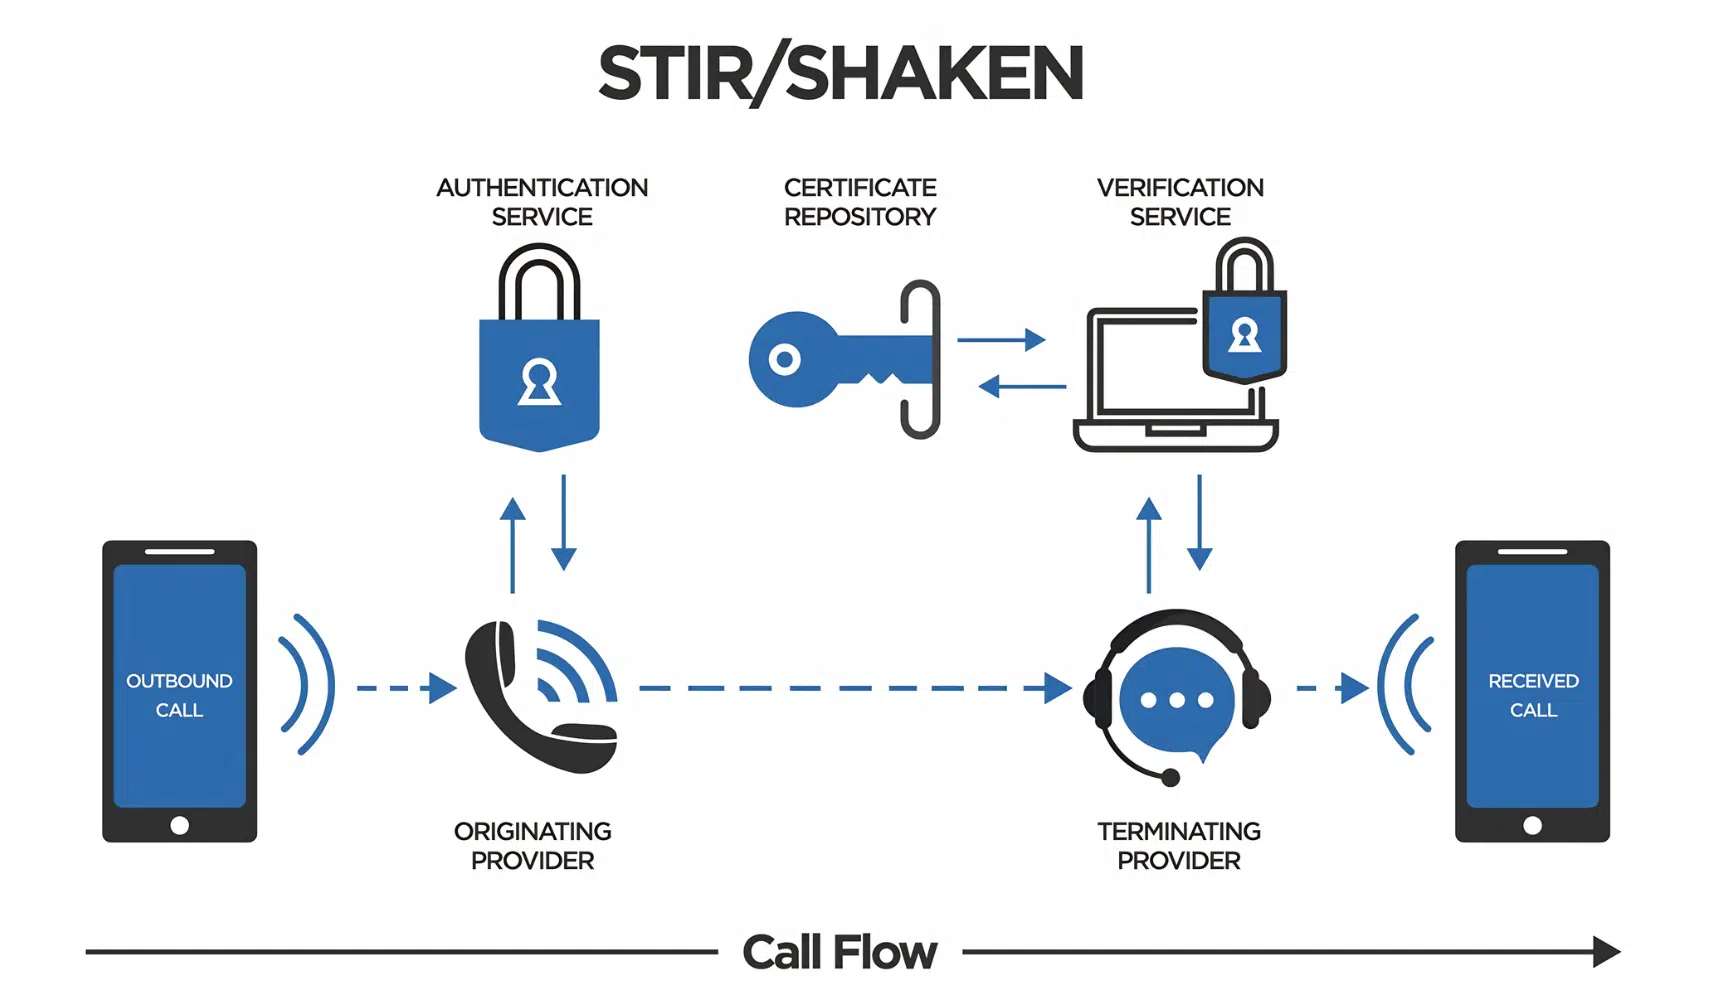
STIR/SHAKEN authentication confirms that a call is real, but it does not prevent a spam label. Labels are generated by reputation analytics engines that analyze calling patterns: volume per number, call duration, answer rates, complaint signals, and geographic spread. A number can hold A-level STIR/SHAKEN attestation and still receive a “Spam Likely” designation from a carrier’s analytics engine.
Key operational considerations for number reputation management:
- DID rotation: Numbers should be monitored, rotated, and retired based on performance signals, not just a clean vs. flagged binary status. A number can be technically clean while quietly underperforming due to accumulated reputation signals.
- Daily call volume per DID: Industry guidance from multiple providers converges around 50 to 75 calls per day per number as the threshold before reputation risk materially increases. Rest and rotation should be built into the campaign structure, not applied reactively.
- Local presence dialing: Static local number pools cycle quickly, which increases per-DID call volume and accelerates reputation damage. Dynamic number pools that rotate based on real-time carrier performance protect reputation while maintaining geographic relevance.
- Number registration: Registering numbers with major analytics providers (Hiya, TNS, First Orion) and the Free Caller Registry reduces the risk of false positives on clean traffic. This does not override poor dialing behavior, but it provides a baseline of recognized identity.
Platform Note: LeadAdvisors runs real-time caller ID health. Tracking number performance before it becomes a contact rate problem is the operational standard in managed campaigns, available as part of campaign QA rather than as a reactive measure after the drop is visible in reporting. For more on managing spam labeling and call tracking, see the related resources.
Fix 3: Multi-Channel Warm-Up Before the Live Dial
Multi-channel warm-up is the highest-impact structural fix for contact rate in a managed financial services campaign. Phone-only campaigns are structurally limited regardless of how well every other variable is configured, because the cold dial to an unrecognized number is where most contact rate is lost.
Research from multiple 2025 to 2026 outbound sources indicates that 80 percent of U.S. adults do not answer incoming calls from unknown numbers. This refers to general consumer behavior with unknown numbers, separate from the additional suppression caused by spam labeling. The warm-up sequence is the mechanism that converts an unknown number into a recognized one before the call goes out.
The difference between a warm dial and a cold dial is most visible in the first five seconds of the call.
On a cold dial, the prospect answers without context, encounters an unfamiliar voice, and has no established reason to stay on the line. That uncertainty is where most contact rate is lost: the prospect hangs up, becomes defensive, or disengages before the agent has any opportunity to qualify.
On a warm dial, the prospect has already seen the brand, responded to a touchpoint, or at minimum registered the name. The first five seconds shift from interruption to continuation, and the agent’s opening lands on prepared ground rather than blank resistance. That distinction is not marginal. It is the structural reason why warm-dial campaigns consistently outperform cold-dial operations on the same lead sources.
The Standard Warm-Up Sequence in a Managed Campaign
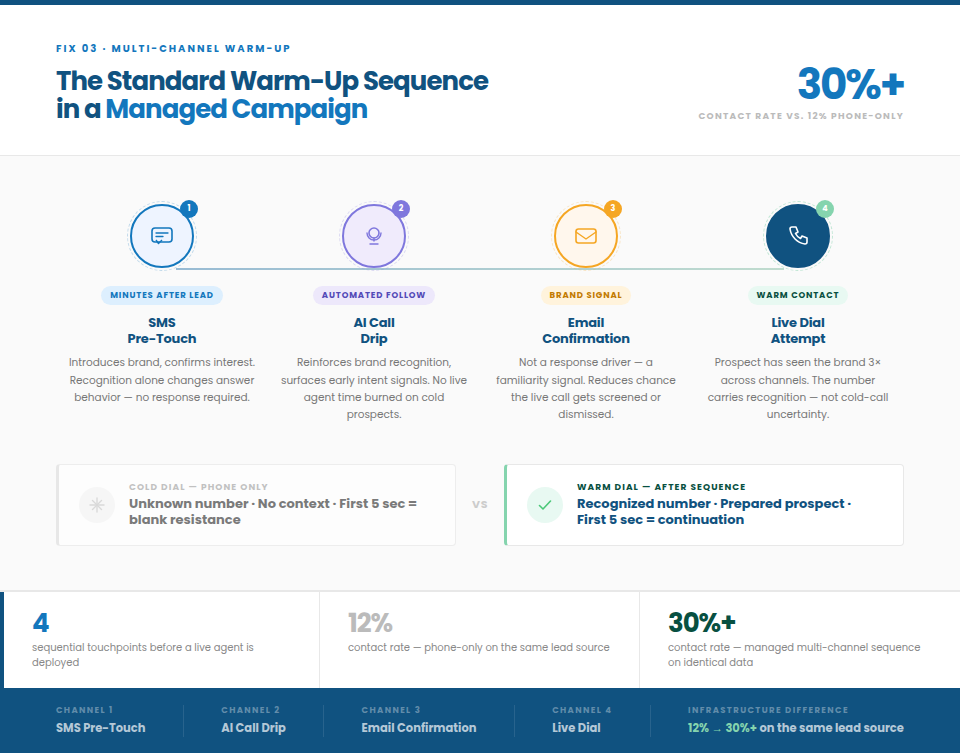
- SMS Pre-Touch: Sent within minutes of lead submission. Confirms the prospect’s interest, introduces the brand, and creates context before the live dial. Response is not required for the sequence to work. Recognition alone changes answer behavior on the subsequent call.
- AI Call Drip: An automated voice touchpoint that follows the initial SMS, reinforcing brand recognition and surfacing early intent signals before a live agent is deployed. AI call drips allow campaigns to maintain consistent outreach volume without burning live agent time on prospects who are not yet ready to engage.
- Email Confirmation: Reinforces the brand and the reason for outreach. Not primarily a response driver. It functions as a brand familiarity signal that reduces the likelihood of the live call being screened or dismissed.
- Live Dial Attempt: By the time the live dial goes out, the prospect has seen the brand across multiple channels, confirmed some level of interest, and the number carries positive recognition rather than cold-call uncertainty. Answer likelihood increases. The opening seconds of the conversation change character entirely.
The sequence runs sequentially, with SMS pre-touch, AI call drip, email confirmation, and then live dial, so every prospect receives consistent multi-touch coverage before an agent attempts live contact. This structure is what allows a managed campaign to convert the same leads at a materially higher rate than a phone-only operation working from identical data.
The Infrastructure Difference: The Managed Dialing Campaign model built by LeadAdvisors includes sequential SMS, AI call drips, email confirmation, and chat AI follow-up layered on top of live dialing as standard campaign components. This multi-channel structure is the measurable difference between a 12 percent and 30-plus percent contact rate on the same lead source. See how automated follow-up fits into the broader nurturing architecture.
Fix 4: Dialer Configuration and Cadence
Even with clean data, a healthy caller ID, and a warm-up sequence in place, dialer configuration determines how efficiently the campaign converts dials into live conversations. Getting this wrong erases gains made elsewhere.
Dialer Type Comparison
Predictive dialers maximize volume but increase abandonment risk when misconfigured. Power dialers are slower but protect the number’s reputation. For financial services operators where reputation protection determines long-term campaign viability, the slower but healthier tradeoff is usually the right one. Parallel dialers increase volume but damage number health through dropped calls when multiple prospects answer simultaneously.
Optimal Timing Windows
The MIT Lead Response Management Study, whose findings have been replicated across more recent benchmark datasets, established that Wednesday and Thursday are the strongest days for live contact and lead qualification.
The 10 AM to 11:30 AM window consistently produces the highest answer rates across consumer financial services campaigns. Time zone detection built into dialing logic is non-negotiable for any national campaign.
Retry Logic
A maximum of two attempts per lead per day and six to eight total attempts over two to three weeks is the documented standard for financial services outbound. Beyond this threshold, additional dials accelerate reputation damage across the entire number pool, not just the leads being over-dialed.
AI-Directed Dialing in 2026
AI is taking over real-time decisions about which number to call, which prospect to prioritize, and which timing window to use, all based on live performance signals. Manual tracking of these variables is no longer operationally viable at scale. For a deeper look at how AI-directed dialing is reshaping outbound operations, see the related resource.
Fix 5: Pre-Qualification Infrastructure
Pre-qualification is the last mile of contact rate optimization. For debt relief specifically, this involves moving beyond basic form-fills to a high-intent debt lead model that prioritizes live engagement. High transfer rejection rates collapse the effective contact rate back to unmanaged-campaign levels, and a well-configured pre-qualification layer is what converts dialing volume into usable, closable transfer volume.
What Pre-Qualification Must Confirm
Before a transfer is initiated, four criteria must be confirmed without exception: minimum qualification threshold (for example, debt balance, loan amount, or property value), state eligibility, expressed interest from the prospect, and availability to continue the call. All four, not a subset.
Soft Transfer vs. Hard Transfer
Soft transfers, where the agent stays on the line during the handoff, produce higher acceptance rates on the sales floor. Hard transfers are faster to execute but generate more rejections. The correct choice depends on the vertical and closer team setup, but the default in high-value financial services transfers is generally soft.
The Daily Feedback Loop
The most important QA function in a managed campaign is the daily communication between the sales floor and the dialing team. If closers report weak intent from a particular lead source or time window, that information needs to reach the dialing team before the next shift, not in a monthly retrospective. Campaigns with a structured daily feedback loop consistently outperform those treating reporting as a periodic review exercise.
Documentation Standard: Transfer criteria documentation should be written, reviewed, and updated. A standard that is not documented is not consistently applied. Pre-qualification scripts that are updated based on daily sales floor feedback maintain their accuracy over time. Those that are not updated degrade as lead source behavior shifts. Related resources: call center quality assurance, pre-qualification script, and completion rate.
The Metrics That Show You Where Contact Rate Is Breaking
Most outbound operations track top-line volume and close rate. The middle of the funnel, where the majority of contact rate problems actually live, remains invisible. The following diagnostic stack surfaces problems before they become campaign-level failures.
Right-Party Contact Rate (RPC)
Live two-way conversations are divided by total leads dialed. This is the primary contact rate metric. Industry benchmarks establish eight to 14 percent as the unmanaged range for financial services outbound; managed campaigns with full infrastructure consistently exceed 30 percent.
If RPC is below 20 percent, the problem is located in pre-qualification, warm-up, data quality, or caller ID issues. See the guide to running a high-performing live transfer campaign for a full breakdown of what each stage requires.
Transfer Acceptance Rate
Of transfers sent to the sales floor, what percentage are accepted by closers as meeting stated criteria? A rate below 80 percent is a pre-qualification failure signal. Closers who consistently receive poor-quality transfers reduce their effort over time, which compounds the contact rate problem downstream in ways that appear to be agent performance issues but are not.
Cost Per Qualified Transfer
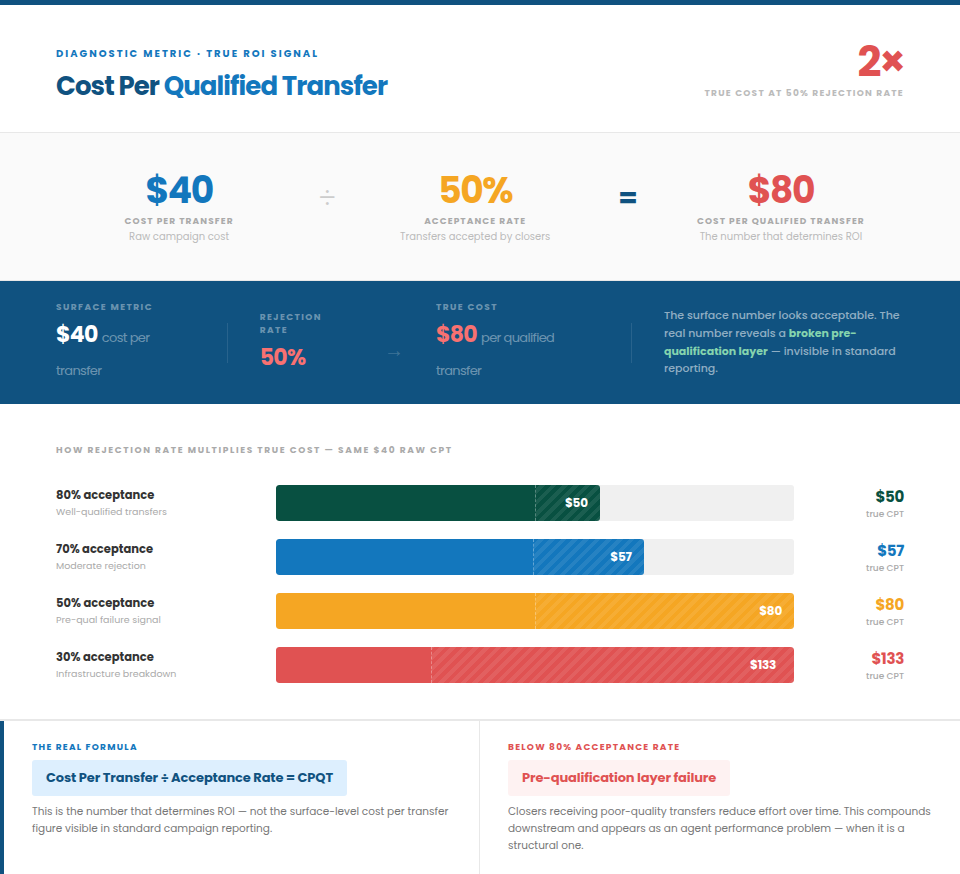
This metric adjusts raw campaign cost for the rejection rate to show what is actually being spent per lead that reaches a closer in a workable state. A campaign with a $40 cost per transfer and a 50 percent rejection rate has an $80 cost per qualified transfer. That is the number that determines ROI, not the surface-level cost per transfer figure.
Speed to Connect
Time from lead submission to live agent conversation. Research replicated and cited widely across 2024 to 2026 benchmark sources establishes that leads contacted within five minutes are 21 times more likely to convert than those reached after 30 minutes. Every hour between lead submission and first dial degrades the contact rate on that lead. Speed to connect should be tracked and reported as a daily campaign metric.
Note: The 21x figure reflects the comparison between the five-minute window and the 30-minute window. A separate figure for conversion drop within the first five minutes of delay is under verification and has been removed from this version pending confirmation.
Dial-to-Contact Ratio by Source
Not all lead sources behave the same. Some convert at 25 percent or above, and others plateau at eight percent regardless of infrastructure quality. Tracking this metric by source allows the budget to shift before a monthly review catches the performance gap, which by that point represents weeks of wasted spend.
Build vs. Buy: Managing Contact Rate Infrastructure In-House vs. Through a Managed Campaign
An operator who has worked through the sections above understands what contact rate optimization actually requires. The decision of how to execute it is a real operational choice, not a binary between competent and incompetent.
Building In-House Requires:
- Data validation and refresh system
- Number rotation and caller ID monitoring infrastructure
- Multi-channel warm-up configuration and sequencing
- Pre-qualification scripting and compliance documentation
- QA monitoring with daily scoring and feedback cadence
- Supervisor coverage and daily reporting to the sales floor
- All of the above recalibrated as lead sources, carrier rules, and prospect behavior change
A Managed Campaign Provides:
- Full infrastructure built and running before the first dial
- Real-time caller ID health monitoring included as standard
- SMS, email, and chat warm-up are layered on live dialing by default
- Pre-qualification scripting is maintained and updated daily
- QA and supervisor coverage are built into the campaign structure
- Daily feedback loop between dialing floor and sales floor
- The operator provides lead criteria; the campaign provides contact rate
Building in-house requires headcount for QA, supervisors, and data management; technology for dialing infrastructure, SMS sequencing, and CRM integration; and management bandwidth to calibrate and maintain all of it while simultaneously running a sales floor. The build cost is real and ongoing, not a one-time investment. Operators evaluating a BPO partner or a fully managed campaign can use a 30-day pilot to validate the model before committing to either path.
For operators who want to validate the model before committing to a full build or a full managed engagement, a structured 30-day pilot on existing lead sources produces real contact rate data before a campaign commitment is made. That data resolves the build-vs-buy question more reliably than any projection.
Key Takeaways
- Contact rate measures live two-way conversations as a percentage of total leads, not answered calls. Voicemails and quick hang-ups are not contacts.
- Unmanaged outbound in financial services averages eight to 14 percent RPC. Managed multi-channel campaigns with full infrastructure, consistently exceeded 30 percent on the same lead sources.
- The five root causes are data decay, caller ID reputation, no warm-up layer, poor dialing cadence, and no pre-qualification structure. Buying more leads addresses none of them.
- Speed to connect is one of the most predictive metrics in the funnel: leads are 21 times more likely to convert when reached within five minutes versus 30 minutes.
- Transfer acceptance rate and cost per qualified transfer are where the real diagnostic data live. Both are invisible in standard volume-and-close reporting.
- 80 percent of U.S. adults do not answer unknown numbers (general consumer behavior with unknown numbers, separate from spam labeling suppression). The warm-up layer is what converts an unknown number into a recognized one before the dial goes out.
- 95 percent of calls labeled “Spam Likely” go unanswered. STIR/SHAKEN authentication verifies that a call is real but does not prevent spam labeling. Labels are driven by analytics engines that monitor calling patterns independently of authentication status.
- The build-vs-buy decision is a real operational choice. A managed campaign delivers the full infrastructure stack on day one; building in-house requires headcount, technology, and ongoing calibration.