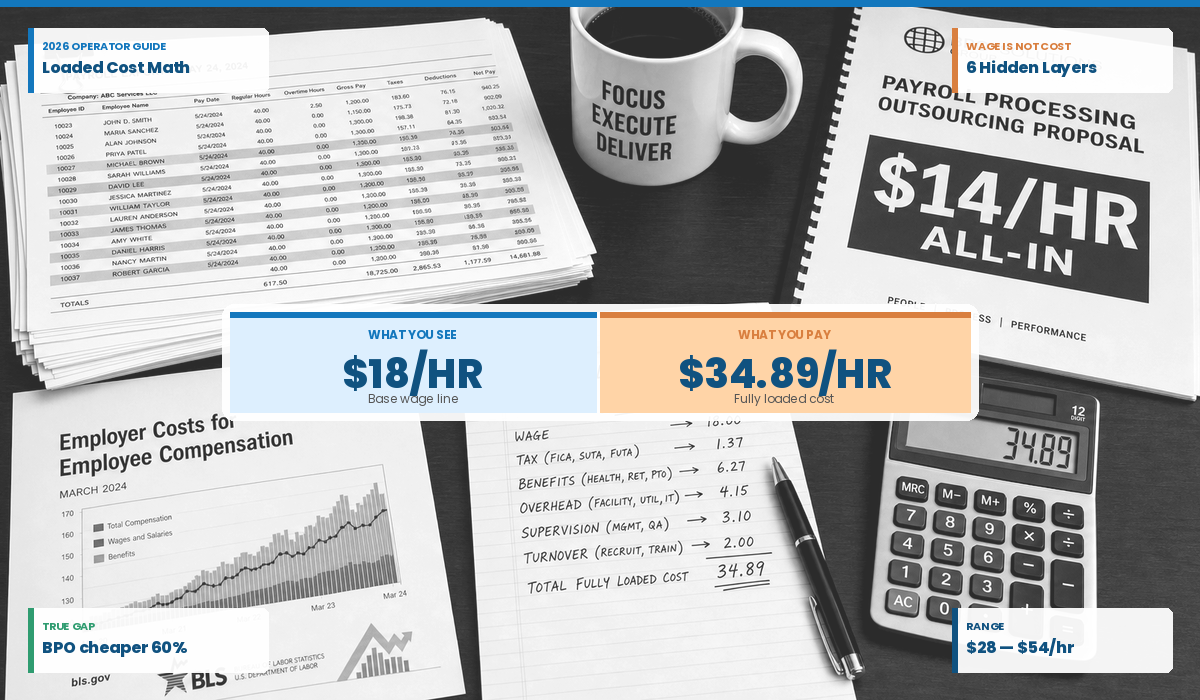
We run outbound floors for a living. Last quarter, we sat in a boardroom in Indianapolis with a CFO, a VP of Ops, and 12 months of payroll exports spread across the conference table. The room had already made its call. The in-house outbound floor looked cheaper than the managed BPO bid that had been sitting on the desk since February. Wage on the floor: $18 an hour. Vendor proposal: $14. Four dollars cheaper to stay put.
Then the CFO asked the question that closes every one of these meetings the same way. “What does one of our agents actually cost us, fully loaded?” The ops side did not have the number. Not because the team was sloppy. Because the number had never been built.
Here is what we see across every floor we audit. The per-hour cost of one seated, productive agent is not included in the payroll report. It scatters across eleven different cost centers, a dozen invoices a year, and a turnover spreadsheet HR keeps in its own corner. Until that number lands on one page, every comparison against a managed alternative starts from the wage line. In 2026, the wage line covers closer to 60 percent of the true cost than the 100 percent that most operators treat it as.
We are operators. Not consultants. This guide builds the number the Indianapolis team should have built two years earlier. Every figure is sourced. Every assumption is on the page. Run the math through, and the next make-or-buy conversation lands on data, not guesswork.

Why the Wage Is Not the Cost
Take the $18 wage from the Indianapolis floor. That wage is the largest single line on the agent’s cost stack. It is not the stack.
Five other layers sit around the wage. Federal and state payroll taxes are paid every quarter. Health insurance, dental, vision, 401(k) match, PTO, and holidays. Office rent or distributed-work tooling. A supervisor running coaching huddles every morning and a QA reviewer scoring three calls a week. A recruiter, a trainer, and an onboarding admin who rerun the cycle every time the seat turns over. The wage appears on the pay stub. The other five layers appear in eleven other places in the general ledger.
BLS publishes the split quarterly in Employer Costs for Employee Compensation. Wages and salaries account for 70.3 percent of total employer compensation costs. Benefits and statutory payroll taxes take the remaining 29.7. BLS does not even factor in facility, equipment, supervision, recruiting, or turnover in the split. Add those layers back in, and the wage drops to roughly 55-60% of the fully loaded cost.
The shorthand is the fully loaded cost. Cornell’s Institute for Compensation Studies uses the same phrase in its Q4 2025 ECI commentary. The term has been standard in labor economics since the early 1980s. The math is older than the phrase. The gap it describes has widened every year since the BLS began publishing the survey.
The six cost categories beyond the base wage:
| Category | What It Includes |
| 1. Payroll taxes & statutory | Social Security, Medicare, FUTA, SUTA, workers’ comp. Legally required, calculated as a percentage of wages. |
| 2. Employee benefits | Health, dental, vision, 401(k) match, PTO, holidays. Use the floor’s actual costs, not industry averages. |
| 3. Overhead allocation | Facility, utilities, equipment, dialer, and software licensing, IT. Scales with headcount. |
| 4. Management & supervision | Supervisors, QA reviewers, and HR staff. Headcount-driven; each agent requires proportional allocation. |
| 5. Recruiting & onboarding | Hiring, training amortized over tenure. With an average annual turnover of 35 to 40 percent, the agent is replaced every 2.5 years. |
| 6. Productivity loss | Training, breaks, meetings, and admin. Reduces productive calling hours below the theoretical maximum. |
The Full Loaded Cost Calculation: Line by Line
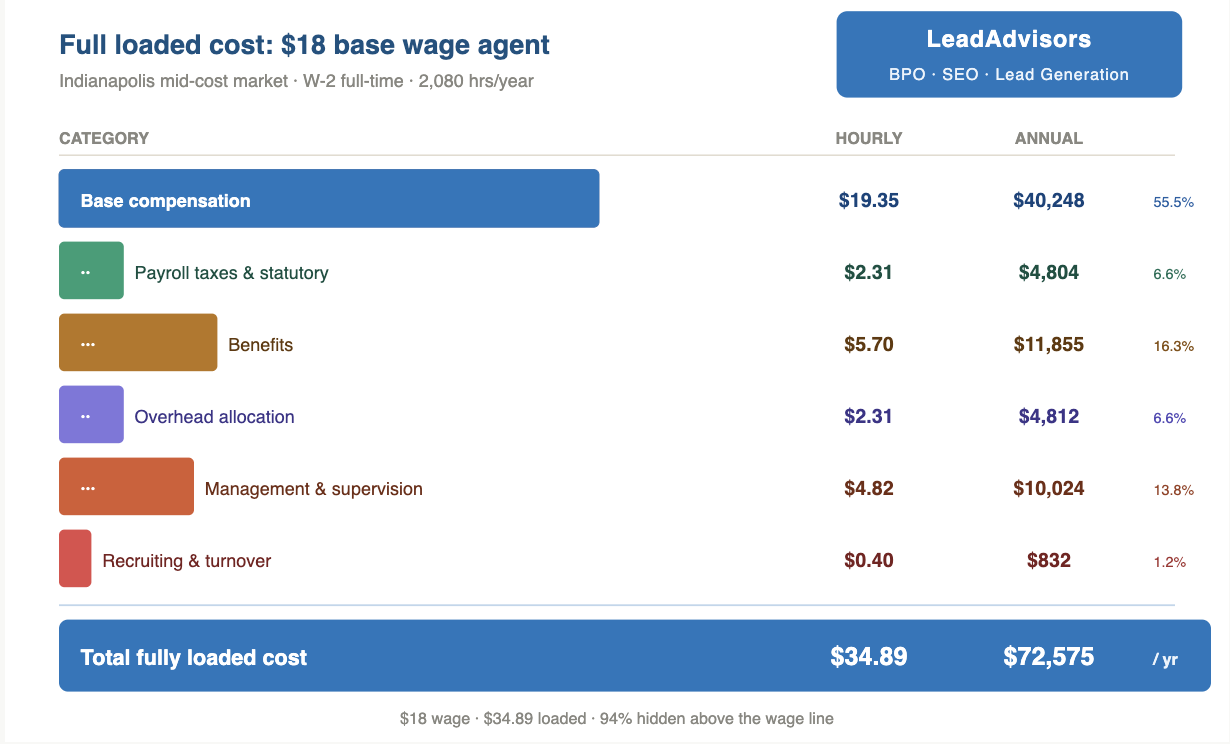
Here is the profile we are pricing: outbound sales agent, full-time W-2, Indianapolis-style mid-cost market, $18 base wage, 40 scheduled hours a week, 2,080 hours a year. Six categories. Hourly and annual on every line.
Category 1. Base Compensation
The 2025 BLS OEWS data for customer service representatives (43-4051) places median pay between $16 and $20 across mid-cost U.S. metros. Coastal cities push it to $22-$28. The line most operators forget is the overtime line. In our outbound campaigns, peak coverage hours usually add 3-7% to the base wage. Small line. Compounds quickly across a full year of payroll.
| Component | Hourly | Annual |
| Base wage | $18.00 | $37,440 |
| Overtime (est. 5% of hours at 1.5x) | $1.35 | $2,808 |
| Subtotal | $19.35 | $40,248 |
Category 2. Employer Payroll Taxes & Statutory Costs
Federal and state rates pulled straight from IRS Publication 15, 2026 (Circular E, Employer’s Tax Guide). These lines are not negotiable. They land in the same place every quarter.
| Component | Rate | Hourly | Annual |
| Social Security (employer) | 6.2% of wages | $1.20 | $2,495 |
| Medicare (employer) | 1.45% of wages | $0.28 | $582 |
| FUTA | 0.6% on first $7,000 | $0.02 | $42 |
| SUTA (avg 2.7%) | 2.7% on taxable wages | $0.52 | $1,081 |
| Workers’ Comp (avg 1.5%) | 1.5% of payroll | $0.29 | $604 |
| Subtotal | $2.31 | $4,804 |
Category 3. Employee Benefits
The number swings hardest in this category. The 2025 Kaiser Family Foundation Employer Health Benefits Survey reports that employer-paid single-coverage health premiums average $7,500 a year. Family coverage clears $20,000. The KFF Summary of Findings PDF breaks the numbers down by industry and firm size. PTO and paid holidays sit in this category, too. Pay still leaves the bank account on those days, even when no calls go out.
| Component | Hourly | Annual |
| Health insurance (employer share, single) | $3.20 | $6,656 |
| Dental and vision | $0.35 | $728 |
| 401(k) match (3%) | $0.58 | $1,207 |
| PTO (10 days) | $0.87 | $1,808 |
| Paid holidays (8 days) | $0.70 | $1,456 |
| Subtotal | $5.70 | $11,855 |
If your agents enroll in family coverage rather than single coverage, the health insurance line moves to $7-$9 per hour. Substitute the number from your actual benefits invoice.
Category 4. Overhead Allocation
A persistent myth we hear on sales calls is that going remote eliminates this category. It does not. The line items shift. Office rent drops out. Internet stipends, home-office stipends, and remote IT support are on the rise. Total moves a few cents per hour either direction. Office rent averaged $28 per square foot in 2025, per SBA business cost guidance. A dialer-plus-CRM seat costs $125 to $200 per month, depending on the stack.
| Component | Assumption | Hourly | Annual |
| Office space | $28/sq ft, 50 sq ft per agent | $0.67 | $1,400 |
| Utilities | $6/sq ft/year per seat | $0.15 | $312 |
| Equipment (amortized 3 yrs) | $3,000 initial cost | $0.48 | $1,000 |
| Dialer and CRM licensing | $150/seat/month | $0.87 | $1,800 |
| IT support allocation | $30/hr × 10 hrs/year | $0.14 | $300 |
| Subtotal | $2.31 | $4,812 |
Category 5. Management & Supervision Infrastructure
Sales floors do not self-supervise. ICMI’s research library places supervisor coverage at 1 per 8 to 12 agents, QA at 1 per 15 to 25 agents, and HR at 0.20 to 0.30 FTE per 10 agents. None of these salaries appears on the agent’s pay stub. All of them are real payroll runs processed by the company every other Friday.
| Component | Assumption | Hourly | Annual |
| Supervisor allocation | 1 per 10 agents @ $28/hr loaded | $2.80 | $5,824 |
| QA reviewer allocation | 1 per 20 agents @ $25/hr loaded | $1.25 | $2,600 |
| HR administration | 0.25 FTE HR @ $32/hr loaded | $0.77 | $1,600 |
| Subtotal | $4.82 | $10,024 |
Category 6. Recruiting, Onboarding & Turnover Cost
SHRM’s 2025 Benchmarking Reports put the cost per hire for hourly non-exempt roles between $1,500 and $4,700. SHRM’s deeper write-up on The Real Costs of Recruitment walks through how that number builds line by line. For call centers specifically, Cornell ILR’s worker turnover study reports annual turnover rates of 30-45%. At 40 percent, each replacement costs roughly $1,580: $300 to post the role, $175 in recruiter time, $105 in interview hours, $200 in onboarding admin, $800 in first-week training. Amortize that across all agents, and the per-agent annual bill lands at $632.
| Component | Hourly | Annual |
| Recruiting & onboarding (40% turnover) | $0.30 | $632 |
| Ongoing training (10 hrs/yr @ $20/hr) | $0.10 | $200 |
| Subtotal | $0.40 | $832 |
Full Loaded Cost Summary
| Category | Hourly | Annual |
| Base compensation | $19.35 | $40,248 |
| Payroll taxes & statutory | $2.31 | $4,804 |
| Benefits | $5.70 | $11,855 |
| Overhead allocation | $2.31 | $4,812 |
| Management & supervision | $4.82 | $10,024 |
| Recruiting & turnover | $0.40 | $832 |
| TOTAL FULLY LOADED COST | $34.89 | $72,575 |
The $18 agent on the Indianapolis floor costs $34.89 fully loaded. Not $18. Not $22. Not $28. The number is $34.89 and holds across all mid-cost U.S. metros with a comparable benefits package. Move the same role to California, New York, or Washington, and the pay ranges from $42 to $52 per hour. Drop it into a low-cost Sun Belt market with a stripped-down benefits package, and it lands between $28 and $32.
How Turnover Rate Changes Everything
Call center work sits near the top of the quit-rate column in the BLS Job Openings and Labor Turnover Survey. It has held that position for the better part of a decade. The downstream cost is predictable. More hiring cycles per year. More agents are on the ramp at any given moment. Tenure drifting down. Output per hour is going with it.
| Turnover Rate | Replacements/yr (10-agent floor) | Annual Turnover Cost | Loaded Cost Impact |
| 40% (industry avg) | 4 agents | $6,320 | +$0.30/hr |
| 60% (poorly managed floors) | 6 agents | $9,480 | +$0.46/hr (+53%) |
| 80% (high-pressure floors) | 8 agents | $12,640 | +$0.61/hr + productivity loss |
The NBER working paper, Worker Productivity and Wages Grow with Tenure and Experience (w30342), adds the productivity layer that the table cannot capture. New agents produce 30 to 40 percent less than fully ramped peers across their first 60 to 90 days. Multiply that drag by your churn rate, and the real cost per contact rises sharply above what the loaded table shows.
Back to Indianapolis. The floor we walked through had a 64 percent annual turnover rate. Their internal math priced agents at $18 an hour. After we ran the full calculation, the actual loaded cost came to $36.40, including productivity drag. The gap between their internal number and the actual one on a 20-seat floor: $383,500 per year. That figure was bigger than the annual cost of their existing supervisor team. It sat on the P&L the entire time, split across so many cost centers that no single line told the truth.
If your floor’s annual turnover rate is above 40 percent, your loaded number is higher than $34.89. The arithmetic is unforgiving on that point.
The Market Rate Adjustment: What Your Geography Adds
Geography moves the loaded number as much as benefits or supervision do. Sometimes more. The 2025 BLS Occupational Employment and Wage Statistics survey shows regional gaps for customer service representatives wider than most operators expect.
| Market | Base Wage Range | Loaded Cost Range |
| U.S. national median (mid-cost) | $16 to $20/hr | $28 to $38/hr |
| High-cost coastal (CA, NY, WA) | $20 to $28/hr | $38 to $54/hr |
| Low-cost Sun Belt (TX, AZ, FL interior) | $15 to $18/hr | $26 to $32/hr |
| Remote/WFH (distributed talent) | $16 to $22/hr | $30 to $42/hr |
Geography alone, holding all other variables constant, creates a $12-$22-per-hour gap between markets. On a 15-seat floor at 160 hours a month, that swings the annual cost by $345,600 to $633,600. Remote operations net roughly flat against in-office: $0.40 saved on facility costs, $0.20 spent back on tooling and stipends. The wage line moves more than the overhead does.
The Managed BPO Comparison: What the Loaded Cost Reveals
Place the in-house-loaded number next to the managed offshore rate. The gap is much wider than the wage-to-rate comparison ever showed.
| Incorrect Comparison | After Loaded Cost Calc | |
| In-house agent | $18/hr (wage only) | $34.89/hr fully loaded |
| Managed offshore BPO | $14/hr all-in | $14/hr all-in |
| Conclusion | In-house is cheaper by $4/hr | BPO is cheaper by $20.89/hr |
On a 10-agent floor running 160 hours a month, the gap works out to $33,424 per month, $401,088 per year, in favor of the managed model. The $14 rate is not just offshore wages. It covers agent pay at local market rates, employer payroll taxes, supervision at one per 10, AI-assisted QA with human review, dialer and CRM licensing, facilities, equipment, HR, recruiting, and ongoing training. For every cost the in-house breakdown treats as a separate line, the managed BPO model consolidates it into a single invoice line. That is what offshore infrastructure looks like once it is built and operated by an operator rather than stacked together by a vendor.
Run on the right basis, the managed offshore option is not cheaper by four dollars an hour. It is cheaper by sixty percent. The gap holds year over year. The variables driving it (benefits inflation, U.S. wage pressure, turnover) all move in the wrong direction for in-house economics.
Scenarios where in-house still wins:
- Floors with under 5 agents, where vendor management overhead cancels per-agent savings.
- Floors with 90+ day ramp periods due to deep product knowledge requirements.
- Floors with regulatory requirements that mandate U.S.-based agents.
How to Calculate Your Floor’s Actual Loaded Cost
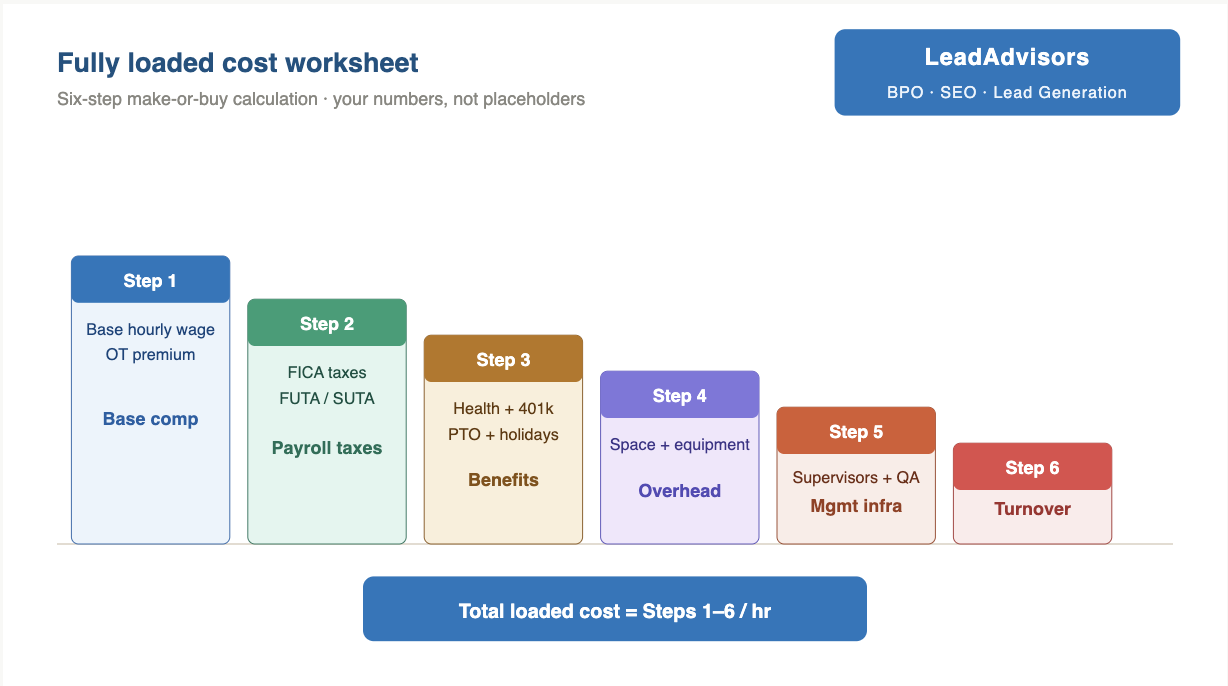
Work through the six steps below with your floor’s real numbers. Pull actual payroll runs, current benefits invoices, and the last twelve months of churn from your HR dashboard. The placeholders above are starting points. The numbers that matter for your make-or-buy decision are yours. This is the worksheet we hand operators on the first call before any commercial conversation starts.
Step 1. Base compensation
- Your agent’s base hourly wage: $___
- Estimated overtime hours per week (typically 5 to 10 percent): ___
- Annual base compensation: (base wage × 2,080) + (OT hours × 1.5x premium × 52)
- Hourly: annual ÷ 2,080 = $___ per hour
Step 2. Payroll taxes & statutory
- Social Security (6.2% of wages up to $168,600): $___/hr
- Medicare (1.45%): $___/hr
- FUTA (0.6% on first $7,000): $___/hr
- SUTA (your state’s rate): $___/hr
- Workers’ comp (your industry rate × wages): $___/hr
- Subtotal: $___ per hour
Step 3. Benefits (use your actual plan costs)
- Health insurance (employer share/month ÷ 173): $___/hr
- Dental & vision (employer share/month ÷ 173): $___/hr
- 401(k) match (match percent × hourly wage): $___/hr
- PTO (days × 8 hrs × hourly wage ÷ 2,080): $___/hr
- Holidays (days × 8 hrs × hourly wage ÷ 2,080): $___/hr
- Subtotal: $___ per hour
Step 4. Overhead
- Office space (cost/sq ft × sq ft per agent ÷ 2,080): $___/hr
- Utilities (annual per agent ÷ 2,080): $___/hr
- Equipment amortized (purchase cost ÷ 3 yrs ÷ 2,080): $___/hr
- Dialer & software (monthly/seat × 12 ÷ 2,080): $___/hr
- Subtotal: $___ per hour
Step 5. Management infrastructure
- Supervisor (loaded hourly ÷ agents per supervisor): $___/hr
- QA (loaded hourly ÷ agents per reviewer): $___/hr
- HR allocation (FTE × loaded hourly × time percent ÷ total agents ÷ 2,080): $___/hr
- Subtotal: $___ per hour
Step 6. Turnover
- Your annual turnover rate: ___%
- Replacements per year (agents × turnover rate): ___
- Cost per replacement (recruiting + onboarding + training): $___
- Annual turnover cost per agent: $___
- Hourly (÷ 2,080): $___/hr
Total fully loaded cost: Steps 1 through 6 combined = $___ per hour
What the Number Means for Your Next Decision
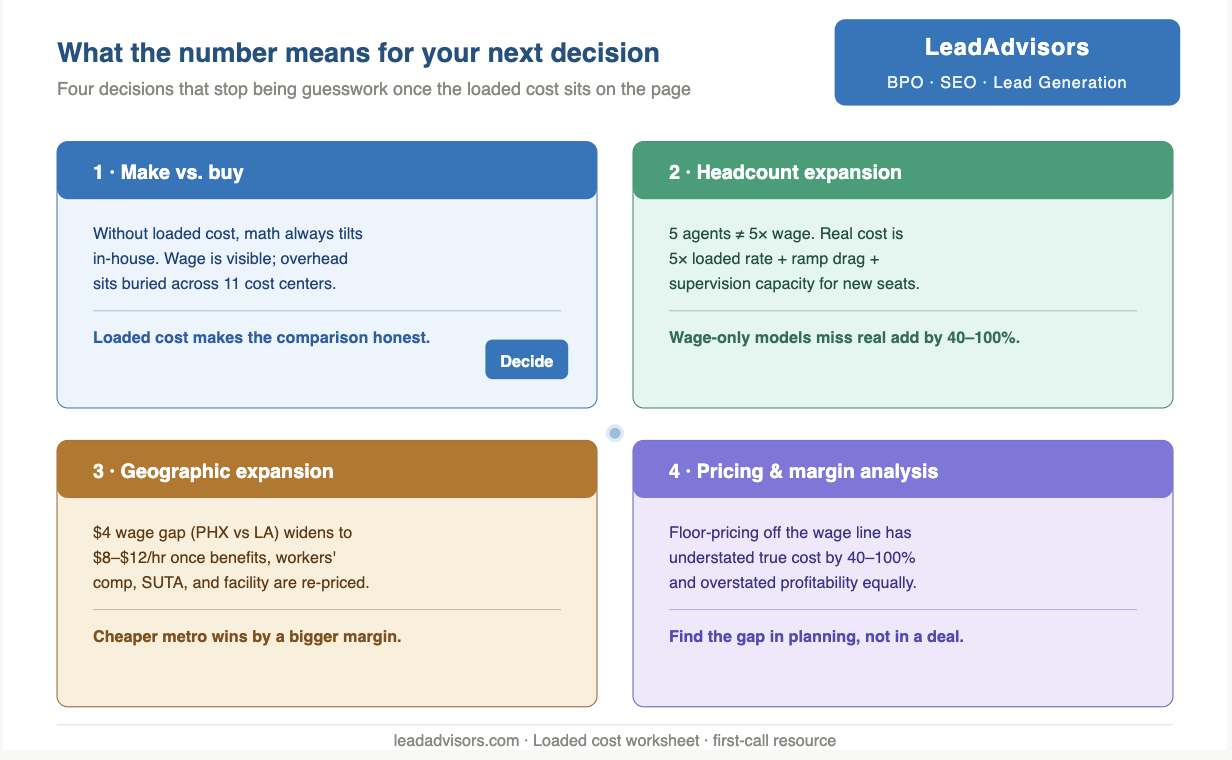
Once the loaded number sits on the page, four decisions stop being guesswork.
- Make vs. buy. With the loaded cost in hand, the comparison is honest. Without it, the math always tilts toward in-house. Not because in-house is actually cheaper, but because the wage is visible while the overhead sits buried across eleven cost centers nobody looks at together.
- Headcount expansion. Adding five agents is not a five-times-wage problem. The real cost is five times the loaded rate, plus the ramp-period output drag every new hire brings, plus the supervision capacity needed to coach the new seats up to the floor’s performance bar. Wage-only headcount models miss the real add by 40 to 100 percent.
- Geographic expansion. The $4 wage gap between Phoenix and Los Angeles widens to $8 to $12 an hour once benefits, workers’ comp, SUTA, and facility costs are re-priced market by market. The cheaper-looking metro often wins by a much bigger margin than the wage spread suggests.
- Pricing and margin analysis. A floor-pricing CPA off the wage line has been understating the true cost by 40-100%. The same percentage has overstated profitability. The gap closes the moment a board, a buyer, or an auditor asks for a cost breakdown. Better to find it during planning than during a transaction.