
Most call centers track dozens of numbers, yet leaders still ask, “What do we do next?” When reports describe activity without direction, teams overcorrect, dashboards bloat, and performance drifts. This guide fixes that.
The Operator Metrics Hierarchy groups metrics by what they drive – capability, infrastructure, conversion, and efficiency – so each KPI points to a decision. You’ll get the metrics to track, how to calculate them, and how to build a dashboard that operators actually use.

The Operator Metrics Hierarchy – Four Categories That Determine What Reporting Drives
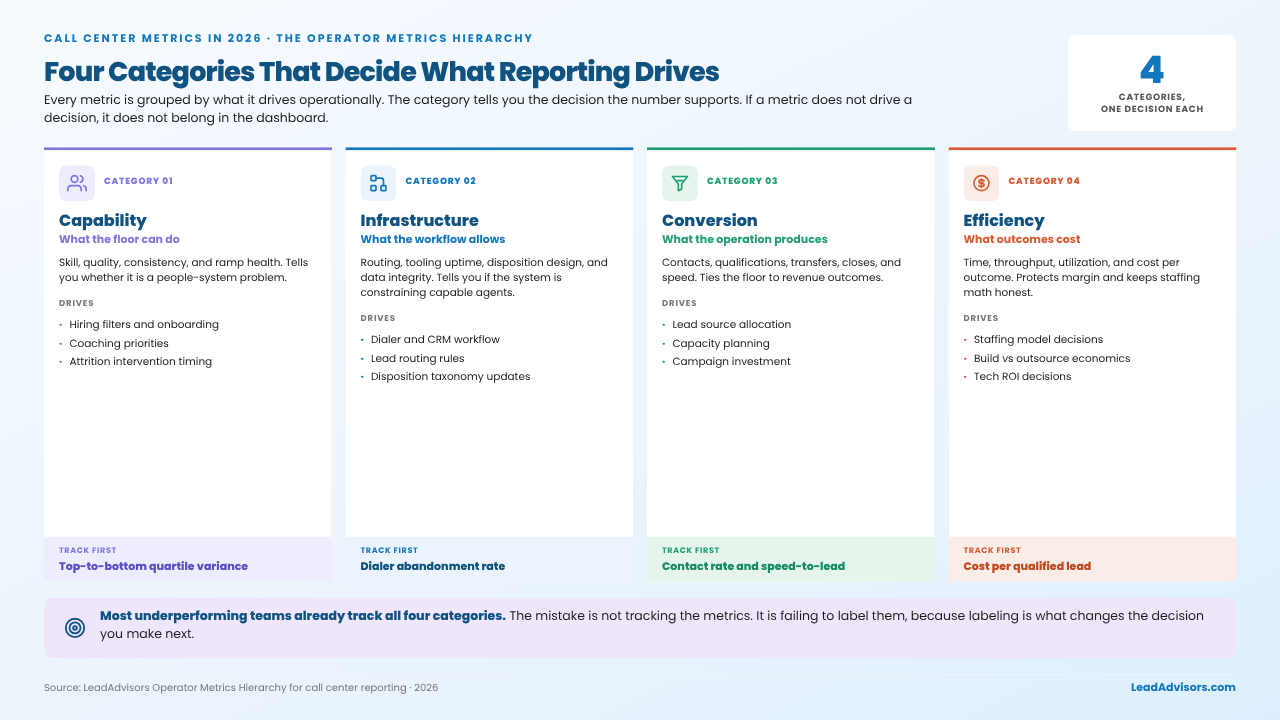
The Operator Metrics Hierarchy organizes call center metrics into four categories based on what each metric drives operationally. The category determines the decision the metric supports.
Here is the rule. If a metric does not drive a decision, it does not belong in the dashboard.
Category 1 – Capability Metrics
Capability metrics measure what the floor can do. They tell you whether performance is a people-system problem.
What they measure
- Agent skill, quality, consistency, and ramp health
Decisions they drive
- Hiring filters
- Onboarding design
- Coaching priorities
- Attrition intervention timing
Core capability metrics
- Top-to-bottom quartile conversion variance
- Quality score by agent
- Tenure distribution
- Ramp-to-benchmark time
- Skill certification progression
If you want one capability diagnostic that moves the floor, track variance first. Averages hide the only thing that matters. Distribution.
Category 2 – Infrastructure Metrics
Infrastructure metrics measure what the workflow allows. They tell you if the system is constraining capable agents.
What they measure
- Routing, tooling uptime, disposition design, and data integrity
Decisions they drive
- Dialer configuration
- CRM workflow redesign
- Script refresh priorities
- Lead routing rules
- Disposition taxonomy updates
Core infrastructure metrics
- Dialer abandonment rate
- CRM data entry completion rate
- Disposition distribution patterns
- Lead routing match rate
- System uptime and integration error rate
Operator rule: if top-quartile agents are underperforming, treat it as infrastructure until proven otherwise.
Category 3 – Conversion Metrics
Conversion metrics measure what the operation produces. They tie the floor to revenue outcomes.
What they measure
- Contacts, qualifications, transfers, closes, and speed
Decisions they drive
- Lead source allocation
- Capacity planning
- Campaign investment
- Closer-to-agent ratios
Core conversion metrics
- Contact rate
- Lead-to-qualified conversion rate
- Qualified-to-closed conversion rate
- Speed-to-lead
- Transfer set rate and show rate
- Revenue per agent and per call
Category 4 – Efficiency Metrics
Efficiency metrics measure what outcomes cost. They protect margin and prevent staffing math from turning into guesswork.
What they measure
- Time, throughput, utilization, and cost per outcome
Decisions they drive
- Staffing model decisions
- Build vs outsource economics
- Tech ROI decisions
- Cost-per-outcome targets by channel
Core efficiency metrics
- Calls per hour per agent (CPH)
- Average handle time (AHT)
- Occupancy rate
- Utilization rate
- Cost per contact
- Cost per qualified lead
- Cost per closed deal
Most underperforming teams track metrics from all four categories. The mistake is not tracking them. The mistake is not labeling them.
Labeling changes what you do next.
Call Center Capability Metrics – What to Measure and How
Capability metrics measure what the floor can do. Five metrics inside the category drive most capability-related decisions.
Metric 1 – Conversion Variance Between Top and Bottom Quartile Agents
What it measures: the performance spread across the floor.
Averages lie. Variance tells you if coaching and onboarding are working.
How to calculate it:
(Top quartile conversion rate) ÷ (Bottom quartile conversion rate)
Benchmarks
- 2x to 4x: normal range at well-run operations
- 4x+: capability development failure
- Under 2x: flat-floor signal
What it drives
- Coaching focus
- Performance management decisions
- Hiring filter calibration
If it is off, check tenure mix, routing match, and QA-to-conversion correlation.
Metric 2 – Quality Score by Agent
What it measures: whether calls meet your rubric.
Quality scoring is not useful unless it predicts outcomes. Scorecards that do not correlate to conversion create fake confidence.
How to calculate it:
Weighted score across compliance, conversation quality, process adherence, and CX.
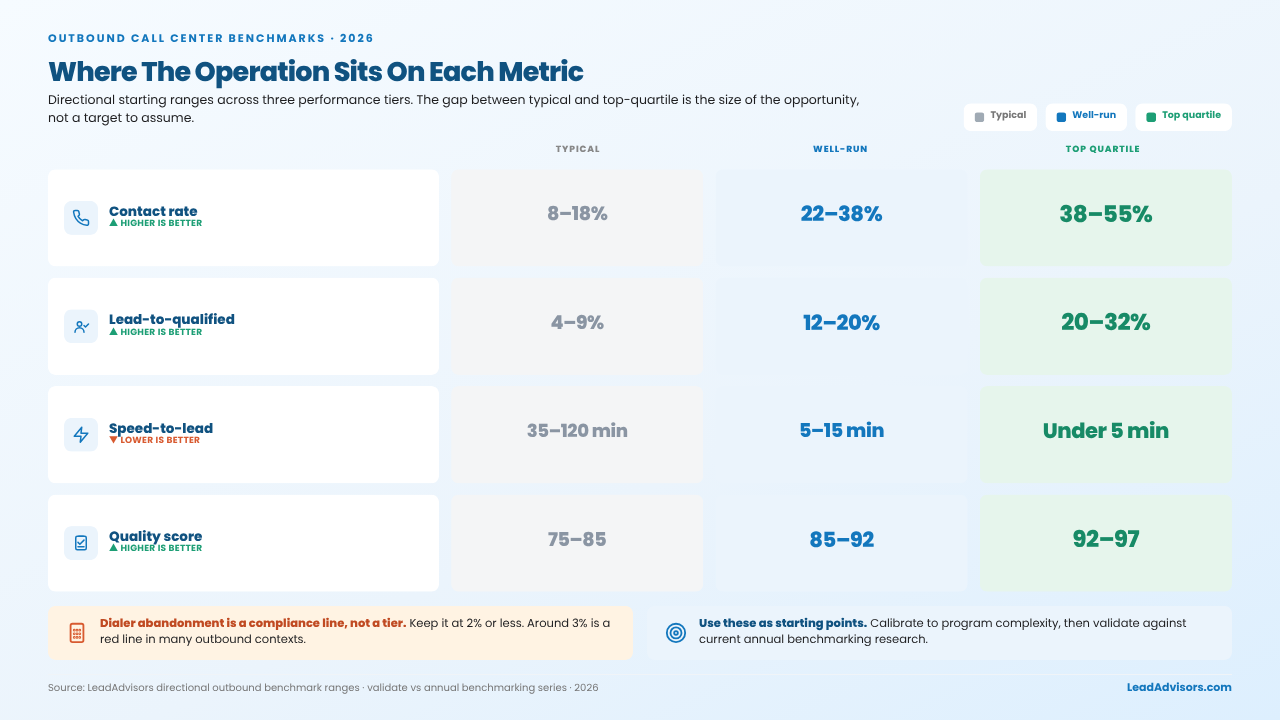
Benchmarks
- 75 to 85: typical
- 85 to 92: well-run
- 92 to 97: top-quartile
What it drives
- Compliance risk monitoring
- Coaching priorities
- Certification and promotion pathways
If it is off, check QA coverage, rubric bias, and reviewer calibration.
Metric 3 – Tenure Distribution Across the Floor
What it measures: whether the floor is structurally stable.
A floor where 40%+ of agents are inside 90 days will not behave like a tenured floor. Do not pretend it will.
How to calculate it:
Headcount per tenure bucket ÷ total headcount.
Buckets: 0-30, 31-90, 91-180, 181-365, 365+.
Benchmarks (well-run baseline)
- 90+ days: 70%+
- 12+ months: 35%+
- 24+ months: 20%+
What it drives
- Capacity planning
- Coaching capacity allocation
- Attrition intervention sequencing
Metric 4 – Ramp-to-Benchmark Time for New Hires
What it measures: how fast new agents reach a sustained performance baseline.
How to calculate it:
Average days from the start date to the first sustained week at the benchmark.
Benchmarks (starting ranges)
- Outbound financial services: 60-90 days
- Customer service inbound: 30-60 days
- Technical support inbound: 75-120 days
- Specialized inbound: 90-180 days
What it drives
- Training design
- Ramp cost math
- Hiring filter validation
Metric 5 – Skill Certification Progression
What it measures: whether agents are moving into higher-skill work.
How to calculate it:
Agents certified at tier X ÷ total floor.
What it drives
- Promotion pathways
- Retention levers for tenured agents
- Routing design (who gets what intent)
Operator note: If capability metrics look “bad,” do not default to coaching. First ask: “Is the floor new, or is the system broken?”
Call Center Infrastructure Metrics – Workflow and Technology Performance
Infrastructure metrics measure what the workflow and technology stack allow agents to do. If capable agents underperform, treat it as infrastructure until proven otherwise.
Metric 1 – Dialer Abandonment Rate
What it measures: the share of outbound dials the dialer abandons before an agent connects.
How to calculate it:
Abandoned calls ÷ total dialed calls
Benchmark (outbound starting ranges)
- 2% to 4% is common.
- 2% or less is the target for well-run environments.
- Around 3% is a compliance red line in many outbound contexts.
What it drives
- Dialer pacing settings
- Predictive vs power vs preview selection
- Compliance risk response
If it is off, check dialer mode, list quality by hour, and agent availability.
Metric 2 – Disposition Distribution Patterns
What it measures: whether your disposition taxonomy produces usable truth.
Bad disposition data creates fake root causes. It also breaks every downstream metric.
How to calculate it:
Calls per disposition ÷ total calls dispositioned
What healthy distribution looks like
- Dispositions represent distinct outcomes.
- “No contact” does not swallow 60%+ of the floor unless the list quality is truly broken.
- “Callback” is not a junk drawer.
What it drives
- Taxonomy redesign
- Coaching focus
- Lead source quality decisions
If it is off, check taxonomy size, ambiguous labels, and incentive design.
Metric 3 – QA Coverage Rate
What it measures: how much of the floor you actually observe.
Low coverage creates biased coaching. It also hides compliance drift.
How to calculate it:
Calls QA-reviewed ÷ total calls
Benchmarks
- Manual QA legacy operations: 2% to 5% coverage.
- AI-assisted QA operations can achieve 95%-100% coverage.
What it drives
- QA tooling decisions
- Coaching cadence and feedback loops
- Compliance confidence
If it is off, check reviewer capacity, calibration, and rubric complexity.
Metric 4 – Lead Routing Match Rate
What it measures: whether the right leads reach the right agents.
Routing mismatch is a silent killer of conversions. It also makes top performers look average.
How to calculate it:
Skill-matched routing assignments ÷ total routing assignments
What it drives
- Skill-based routing rules
- Certification tier definitions
- Queue and campaign design
If it is off, check skill tagging, lead metadata quality, and overflow rules.
Metric 5 – System Uptime and Integration Error Rates
What it measures: whether tools are stable enough for clean reporting and clean execution.
If systems drop, metrics lie. Agents also develop workarounds.
How to calculate it
- Uptime hours ÷ total scheduled hours
- Integration errors ÷ total integration events
What it drives
- Vendor SLA enforcement
- Integration priority list
- Workflow redesign decisions
If it is off, check failure points, release-related spikes, and manual workarounds.
Metric 6 – CRM Data Entry Completion Rate
What it measures: whether the floor is producing usable operational data.
How to calculate it: Completed required fields ÷ total required fields across interactions.
What it drives: workflow simplification and reporting reliability.
Operator rule: When top agents drop below the benchmark, assume infrastructure first. Then prove a capability issue.
Call Center Conversion Metrics – What the Operation Produces
Conversion metrics measure what the operation produces in revenue-relevant outcomes. Use them with the capability and infrastructure context so you fix the constraint, not the symptom.
Metric 1 – Contact Rate
What it measures: the share of prospects you reach for a meaningful conversation.
Contact rate is not “dials that connect.” It is conversations that allow qualification.
How to calculate it:
Connected conversations ÷ unique prospects dialed
Benchmarks (outbound starting ranges)
- 8% to 18% is typical.
- 22% to 38% is well-run.
- 38% to 55% is in the top quartile.
What it drives
- Channel mix decisions (phone + SMS + email)
- Dialing pattern and attempt logic
- Lead source quality calls with marketing
If it is off, check the list quality by hour, caller ID reputation, and lead freshness.
Metric 2 – Lead-to-Qualified Conversion Rate
What it measures: whether your contacts are the right people.
A high contact rate with low qualification usually means targeting problems. Or script problems.
How to calculate it:
Qualified leads ÷ contacted leads
Benchmarks (outbound starting ranges)
- 4% to 9% is typical.
- 12% to 20% is well-run.
- 20% to 32% is in the top quartile.
What it drives
- Qualification criteria calibration
- Script updates
- Lead source ROI decisions
If it is off, check taxonomy integrity, adherence to criteria, and segmentation quality.
Metric 3 – Qualified-to-Closed Conversion Rate
What it measures: whether the handoff produces revenue.
This metric is a joint ownership metric. Ops cannot fix it alone.
How to calculate it:
Closed-won deals ÷ qualified leads transferred
What it drives
- Closer-to-agent ratios
- Handoff process redesign
- Qualification standards tightening or loosening
If it is off, check the transfer notes, timing, and the closer’s follow-up speed.
Metric 4 – Speed-to-Lead
What it measures: time from lead creation to first contact attempt.
Speed-to-lead is infrastructure. It is also a conversion.
How to calculate it:
Timestamp of first attempt minus lead creation timestamp
Benchmarks (starting ranges)
- 35 to 120 minutes is typical.
- 5 to 15 minutes is well-run.
- Under 5 minutes is top-quartile.
What it drives
- Routing rules
- On-call coverage design
- Automation decisions for immediate response
If it is off, check intake delays, overflow logic, and after-hours routing.
Metric 5 – Transfer Set Rate and Show Rate
What it measures: whether a qualification turns into a real next step.
How to calculate it
- Set rate: Set appointments ÷ qualified prospects
- Show rate: Shows ÷ set appointments
What it drives
- Qualification standards
- Confirmation workflows
- Transfer receiving process design
If it is off, check expectation setting, confirmations, and the appointment time.
Metric 6 – Revenue Per Agent and Revenue Per Call
What it measures: output per unit of labor and per unit of activity.
This metric forces truth. It also forces segmentation.
How to calculate it
- Total revenue ÷ agent count
- Total revenue ÷ total calls
What it drives
- Capacity decisions
- Channel allocation
- Build vs outsource economics
If it is off, check lead mix shifts, ramp distribution, and routing match.
Conversion metrics without context on capabilities and infrastructure yield the wrong fix. Diagnose the constraint before you change the script.
Call Center Efficiency Metrics – What the Operational Costs
Efficiency metrics measure what outcomes cost. Use them to improve the system, not punish the floor.
Metric 1 – Calls Per Hour Per Agent (CPH)
What it measures: connected calls per agent per scheduled hour.
How to calculate it:
Total connects ÷ (agent count × scheduled hours)
Benchmarks by dialer environment
- Predictive dialer: 18 to 35 connects per hour
- Power dialer: 12 to 22
- Preview dialer: 6 to 14
What it drives
- Dialer configuration
- List and targeting decisions
- Staffing math
If it is off, check
- Wrap time and ACW standards
- List quality
- Dialer pacing and availability
Metric 2 – Average Handle Time (AHT)
What it measures: average interaction duration, including talk, hold, and after-call work.
AHT is not a north star. It is a cost lever.
How to calculate it:
(Talk time + hold time + ACW) ÷ total interactions
Benchmarks (starting ranges)
- Customer service: 5 to 7 minutes
- Technical support: 8 to 14 minutes
- Sales inbound: 6 to 10 minutes
What it drives
- Workflow optimization
- Knowledge base and scripting updates
- Training priorities
If it is off, check
- Repeat contacts from low FCR
- Tool friction in the CRM
- Unclear policies are forcing escalations
Metric 3 – Occupancy Rate
What it measures: how busy agents are while logged in.
High occupancy feels efficient. It also burns floors down.
How to calculate it:
(Talk time + ACW) ÷ total logged-in time
Benchmarks
- 75% to 85% is common.
- 80% to 88% can be sustainable.
- Sustained 90%+ is a burnout signal.
What it drives
- Intraday staffing moves
- Schedule tuning
- Cross-skill routing decisions
If it is off, check
- Staffing vs volume mismatch
- Break and meeting timing
- Queue design and overflow
Metric 4 – Utilization Rate
What it measures: productive time as a share of paid time.
Utilization answers a different question than occupancy. Do not mix them.
How to calculate it:
Productive time ÷ total paid time
What it drives
- Shrinkage management
- Staffing model decisions
- Paid-time efficiency analysis
If it is off, check
- Meeting load
- Training design
- Adherence and schedule compliance
Metric 5 – Cost Per Contact
What it measures: fully loaded cost per connected call.
How to calculate it:
Total operational cost ÷ total connects
What it drives
- Channel mix decisions
- ROI on automation
- Outsourcing comparisons
Metric 6 – Cost Per Qualified Lead
What it measures: cost to produce one qualified lead.
How to calculate it:
Total operational cost ÷ qualified leads
What it drives
- Lead source allocation
- Staffing math
- Script and routing ROI
Metric 7 – Cost Per Closed Deal
What it measures: cost to produce a closed-won deal.
How to calculate it:
Total operational cost ÷ closed-won deals
What it drives
- Profitability analysis
- Capacity planning
- Build vs outsource economics
Operator note: If you are optimizing AHT or occupancy and CSAT drops, you are trading short-term cost for long-term volume. Stop and reset.
Inbound Vs Outbound Call Center Metrics – The Key Differences
Inbound and outbound share the same metric categories, but targets differ. Benchmark them separately.
Inbound-Specific Metrics (keep these distinct)
- Service level: calls answered within target time ÷ calls offered (often tracked as 80/20 or 85-92% in 20s).
- First call resolution: issues resolved on first contact ÷ total issues.
- CSAT: satisfied responses ÷ total responses.
- Abandon rate: caller abandons ÷ calls offered.
Outbound-Specific Metrics
- Connect rate: connects ÷ dials (diagnostic upstream of contact rate).
- CPH: pacing metric (not a “work harder” metric).
- Dialer abandonment: early compliance signal; tune as a system setting.
How to Build a Call Center Metrics Dashboard That Drives Decisions
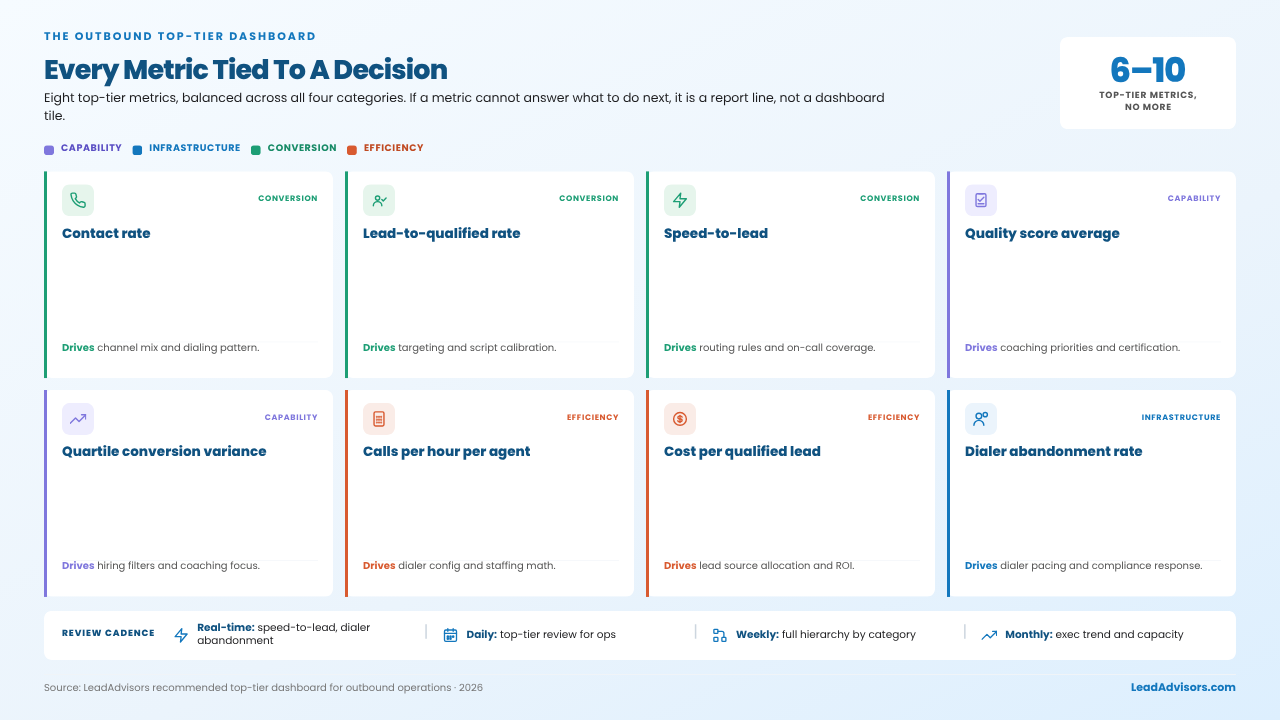
A call center metrics dashboard drives decisions by surfacing 6 to 10 top-tier metrics, organizing secondary metrics into the Operator Metrics Hierarchy category, and tying each metric to a specific operational decision.
Here is the build rule. If the dashboard cannot answer “what do we do next,” it is a report. Not a dashboard.
Dashboard Design Principles
Principle 1 – Limit Top-Tier Metrics to 6 to 10
More than 10 top-tier metrics create noise. Fewer than 6 creates blind spots.
Principle 2 – Organize Secondary Metrics by Hierarchy Category
When a top-tier metric breaks, you need a clean path to root cause. Categories give you that path.
Principle 3 – Tie Every Metric to a Decision
Add one line under every metric: “This drives _.”
If you cannot fill the blank, remove the metric.
Principle 4 – Show Trend, Not Just Snapshot
A snapshot causes overreaction. Trend creates operational judgment.
Show:
- 7-day trend for speed
- 30-day trend for stability
- 90-day trend for structural shifts
Recommended Top-Tier Dashboard for Outbound Operations
- Contact rate (conversion)
- Lead-to-qualified conversion rate (conversion)
- Speed-to-lead (conversion)
- Quality score weighted average (capability)
- Top-to-bottom quartile conversion variance (capability)
- Calls per hour per agent (efficiency)
- Cost per qualified lead (efficiency)
- Dialer abandonment rate (infrastructure)
Recommended Top-Tier Dashboard for Inbound Operations
- Service level (conversion/quality)
- First call resolution (conversion/quality)
- Customer satisfaction score (conversion/quality)
- Average handle time (efficiency)
- Quality score weighted average (capability)
- Occupancy rate (efficiency)
- Abandon rate (infrastructure)
Recommended Dashboard Cadence
- Real-time: service level (inbound), dialer abandonment (outbound), speed-to-lead (both)
- Daily: top-tier dashboard review for ops leadership (see reporting dashboards)
- Weekly: full hierarchy review by category owners (use this weekly BPO ops review template)
- Monthly: exec trend review and capacity planning
Common Call Center Metrics Mistakes That Compromise Decisions
Most reporting failures come from a handful of predictable mistakes.
- No decision tied to the metric: The dashboard becomes a monthly ritual instead of a weekly operating system.
- Occupancy vs. utilization confusion: You’re solving the wrong staffing problem.
- AHT treated as performance: Cost improves while quality and resolution degrade.
- Service level without an abandonment rate: The customer experience is worse than the headline number suggests.
- Quality score without outcome correlation: QA becomes a vanity metric.
- No tenure segmentation: Averages hide where performance is actually breaking.
The fix: segment capability and conversion by tenure buckets.
Call Center Metrics Benchmarks by Operation Type in 2026
Call center metrics benchmarks vary by operation type, geography, and program complexity. Use benchmarks as starting points. Then calibrate to your operation. Benchmark ranges below are directional and should be validated against current annual benchmarking research (e.g., the COPC Global Benchmarking Series).
Outbound Call Center Benchmarks
- Contact rate: 22% to 38% well-run, 38% to 55% top-quartile (directional; validate vs annual benchmarks such as the ContactBabel US Contact Center HR & Operational Benchmarks)
- Lead-to-qualified conversion: 12% to 20% well-run, 20% to 32% top-quartile
- Speed-to-lead: under 15 minutes, well-run, under 5 minutes, top-quartile
- Calls per hour per agent: 18-35 predictive, 12-22 power, 6-14 preview
- Dialer abandonment rate: under 2%, well-run
- Quality score: 85-92 well-run, 92-97 top-quartile
Customer Service Inbound Benchmarks
- Service level: 85% to 92% in 20 seconds, well-run
- First call resolution: 75% to 85% well-run
- Customer satisfaction: 80% to 90% satisfied with a well-run
- Average handle time: 5 to 7 minutes
- Abandon rate: under 5%, well-run
- Occupancy: 80% to 88% sustainable
The Benchmark That Matters Most
Conversion variance between top and bottom quartile agents.
That metric indicates whether the operation is structurally healthy.