
Most BPO clients learn about problems during the monthly review. By then, three to four weeks of recoverable revenue have already been lost.
According to Ryan Strategic Advisory’s 2026 CX & BPO Trends report, structured performance reviews are now a baseline expectation from enterprise buyers, not a bonus. Clients who review performance weekly catch problems faster and hit their targets more consistently.
A weekly BPO ops review takes 45 minutes. It covers the same seven numbers every week in the same order. It catches problems in days, not weeks. And it turns vendor management into real operational control.
This post gives you the full template: the seven metrics, the 45-minute agenda, the performance benchmarks, and the accountability steps that turn flagged data into real decisions. The full template is in Section 4.

Why a Weekly Schedule Is the Right Frequency
More frequent reviews don’t always mean better results. In fact, daily reviews often do more harm than good.
As documented by the Contact Center Association of the Philippines (CCAP), daily performance data in outbound campaigns is highly noisy. Day of the week, lead quality, and agent attendance all shift numbers, even when nothing is actually wrong.
Three problems come from reviewing performance every day:
- Over-correction: you make changes based on noise, not real problems
- Alert fatigue: flags lose meaning when they appear every single day
- Slow decisions: daily reviews rarely produce the clear action items that weekly reviews create
Why Monthly Reviews Miss the Window
Monthly reporting is too slow for outbound BPO campaigns. A qualification rate that drops from 42% to 31% over three weeks is a serious problem. But if you only review monthly, you won’t catch it until week four, and you won’t fix it until week five or six.
Research from ICMI confirms that script compliance problems, one of the top causes of drops in qualification rates, are much easier and cheaper to fix when caught early. The longer a compliance gap goes unnoticed, the more it costs to fix.
The Weekly Review as a Fix Mechanism
The weekly review doesn’t replace daily reporting. It uses daily data as its raw material. Each week, you look at seven days of numbers, spot the trends that daily data hides, and assign clear action items with deadlines.
A problem caught at day seven is far cheaper to fix than one caught at day 23. The weekly review enables day-seven detection.
The Seven Metrics Every Weekly BPO Review Must Cover
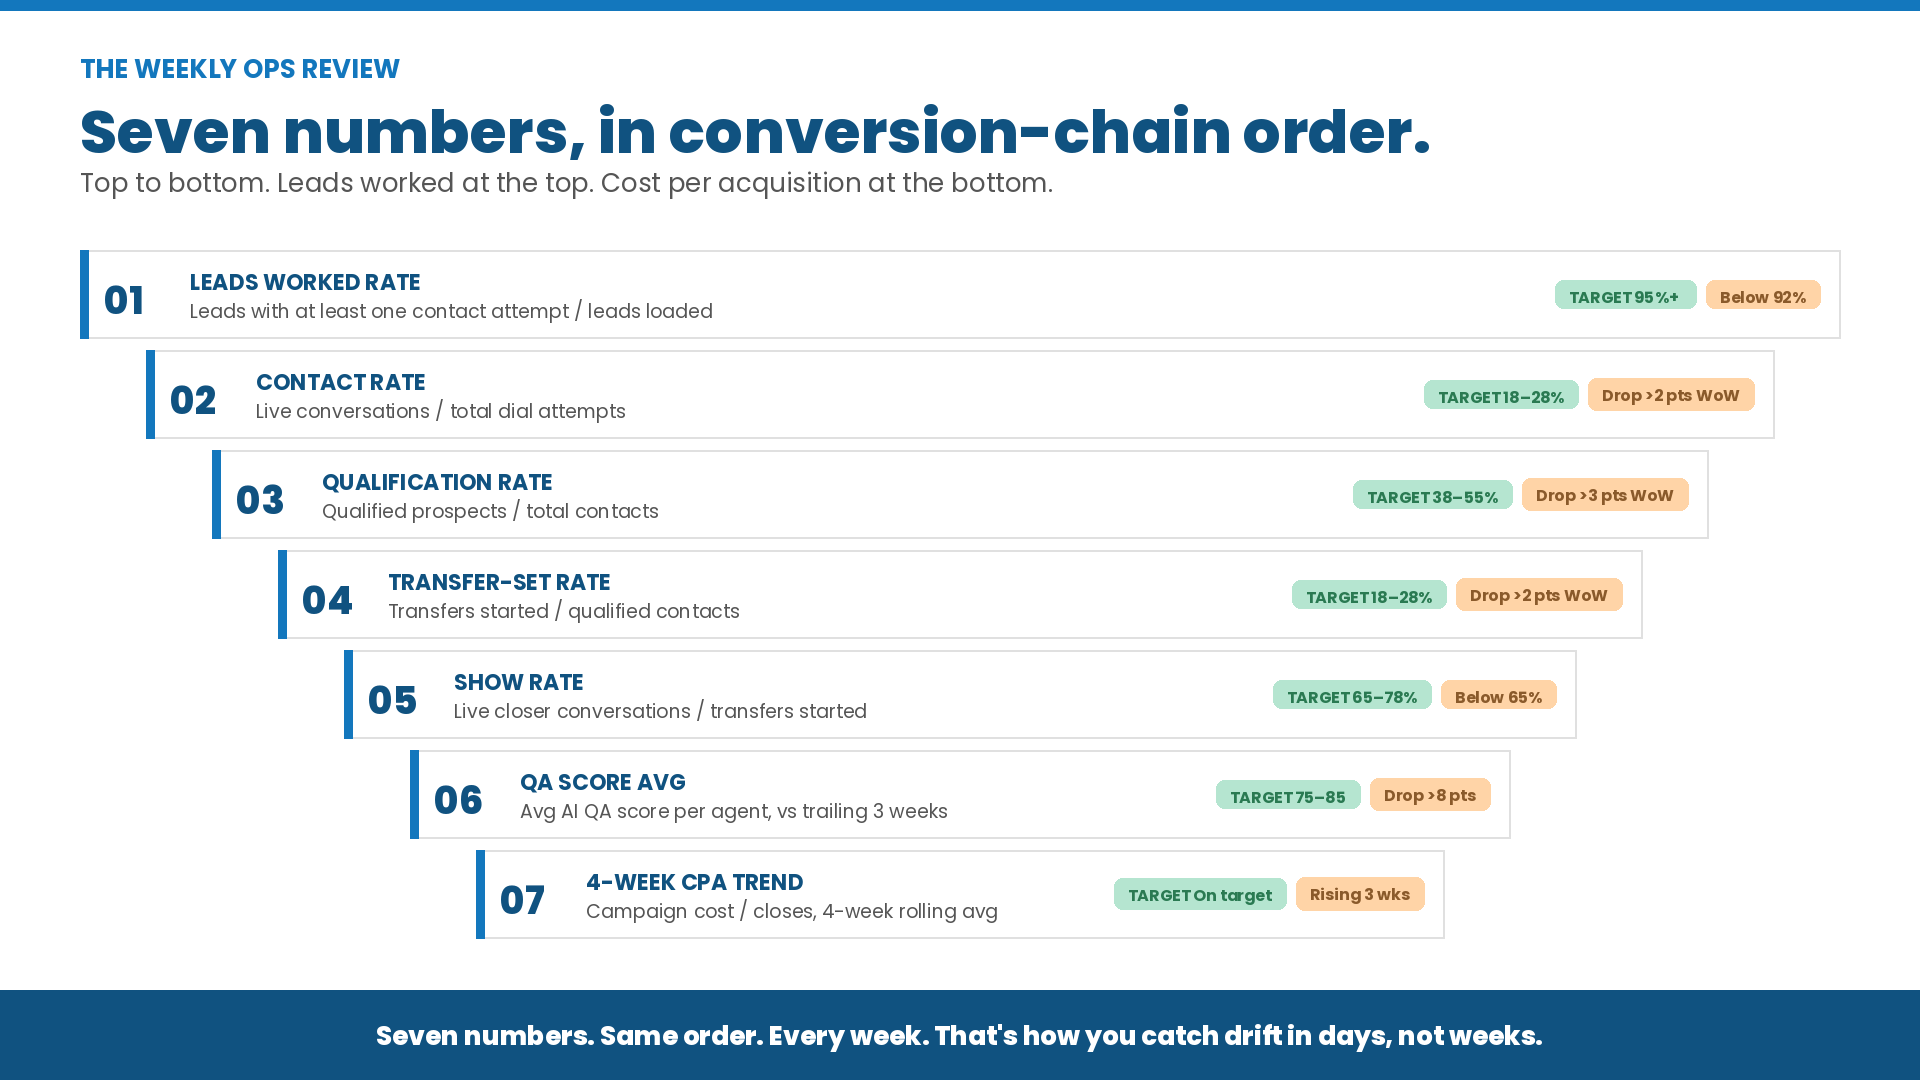
Not every metric belongs in a weekly review. Seven do. They follow the conversion chain from top (leads worked) to bottom (revenue impact).
Ryan Strategic Advisory’s 2026 CX & BPO Trends analysis shows that BPO programs with structured performance frameworks identify root causes faster and achieve CPA targets more consistently.
Metric 1: Leads Worked Rate
Total leads that got at least one contact attempt, divided by total leads added that week.
An unworked lead rate above 5% is a flag. It means either agents aren’t reaching the full list, or leads aren’t being loaded and assigned correctly.
Metric 2: Contact Rate
Live conversations are divided by the total number of dial attempts for the week. Compare this week’s number to the past three weeks to spot direction.
A drop of more than 2 percentage points week over week warrants a root cause analysis. A drop of more than 4 points needs a formal response item before the next review.
According to 2026 BPO KPI benchmarks from GigaBPO, campaigns with structured weekly reviews consistently outperform those without formal oversight.
Metric 3: Qualification Rate
Qualified prospects divided by total contacts for the week. This shows whether leads are a good fit and whether agents are using the qualifying script correctly.
A rate well below your campaign’s normal range usually has one of three causes: a shift in lead quality, script drift, or criteria errors. Each needs a different fix, and the weekly review is where you find the right one.
Metric 4: Transfer-Set Rate
Transfers started, divided by qualified contacts. This isolates handoff quality. Of all the prospects who met your criteria, how many actually transferred to a closer?
A below-target rate usually means either a problem at the transfer step or prospects dropping off between qualification and the actual transfer.
Metric 5: Show Rate
Live closer conversations, divided by the number of transfers started. This is a shared accountability metric. It reflects both vendor-side transfer quality and your team’s closer availability.
In a good weekly review, the show rate is split into vendor-side drops and client-side drops. Combining them into a single number obscures accountability on both sides.
Metric 6: QA Score Average
The average AI QA score across all qualifying calls for the week, broken out by agent. Compared to the past three weeks.
McKinsey’s research on AI-assisted QA shows that AI monitoring improves compliance accuracy by up to 30%. Reviewing that data weekly, not monthly, means you catch script drift while coaching can still fix it.
An agent whose QA score drops more than 8 points in a week gets a coaching action item in that same review. A campaign-level drop of more than 5 points triggers a formal script compliance review.
Metric 7: Week-Over-Week CPA Trend
Total campaign cost for the week divided by closes, compared to the past three weeks. Show this as a four-week rolling average.
CPA ties all your operational data to the actual business result. If your four-week rolling CPA rises for three weeks in a row, that calls for a formal campaign review, not just a discussion item.
The 45-Minute Weekly Review Agenda
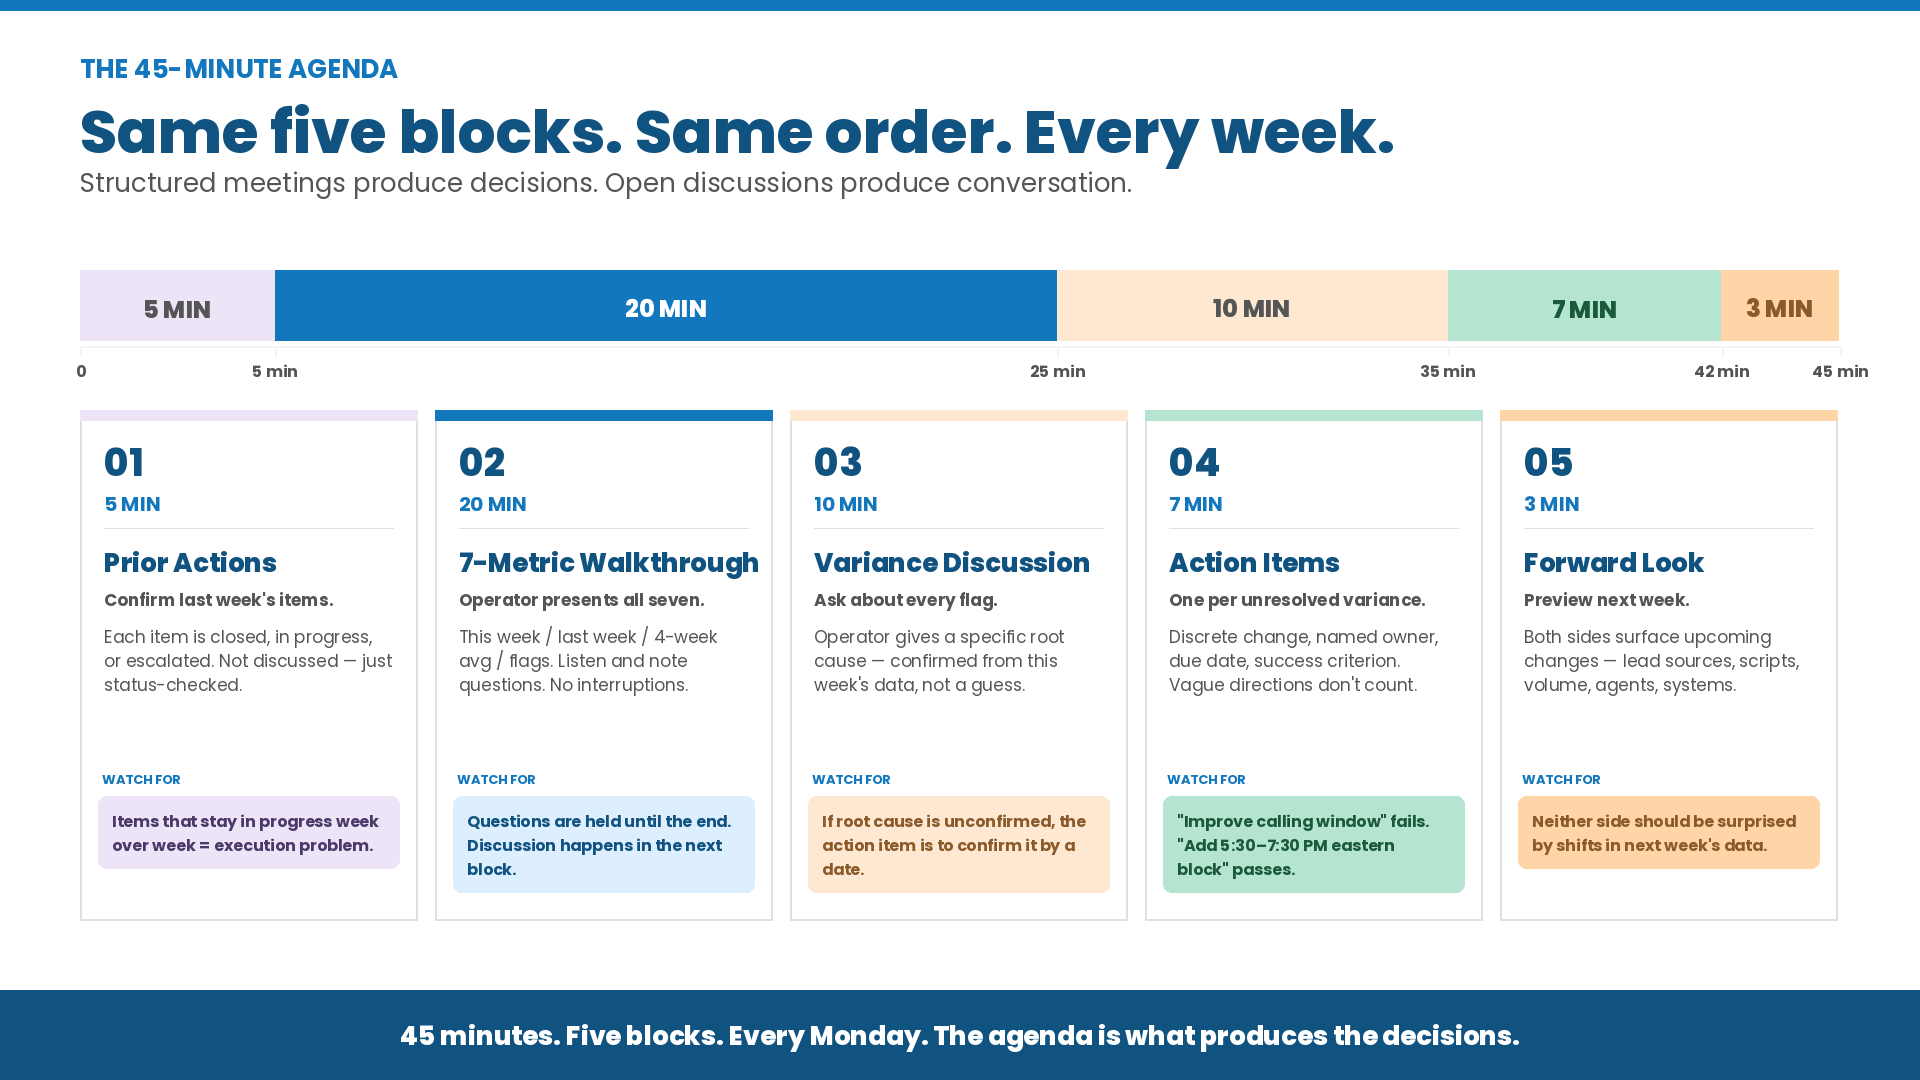
The weekly review works because it follows the same format every week. When both sides know the agenda in advance, they prepare beforehand rather than during the meeting.
Cornell University’s ILR School research on workplace meetings shows that structured meetings beat unstructured ones on every measure that matters: time to decision, ownership assignment, and action item completion. A meeting with a fixed agenda produces decisions. An open discussion produces conversation.
Minutes 1–5: Prior Week Action Items
Every review starts by confirming last week’s action items, not discussing them, and confirming their status. Each item is either closed (done, outcome noted), in progress (on track with a deadline), or escalated (not done, reason to discuss).
If items keep showing up as in progress week after week, that’s an execution problem to address on its own.
Minutes 5–25: Seven Metric Walkthrough
The operator walks through all seven metrics in order. For each one: this week, last week, four-week average, and any flags.
Your job during this section is to listen and note your questions. Discussion happens after all seven metrics are presented, not in the middle of the walkthrough.
Minutes 25–35: Variance Discussion
You ask about flagged metrics or unexpected moves. The operator gives specific root causes, not general explanations.
Minutes 35–42: Action Items
Every unresolved variance gets a specific action item: a discrete change, a named owner, and a completion date.
Vague directions don’t count. “Reconfigure the calling window to add the 5:30–7:30 PM block for eastern timezone leads” is an action item. “Improve the calling window strategy” is not.
Minutes 42–45: Forward Look
Both sides preview upcoming campaign changes. This way, neither side is surprised by shifts in next week’s data.
The Weekly Review Template – The Actual Document
WEEKLY BPO OPS REVIEW Campaign: [Campaign Name] | Week of: [Date Range] | Reviewer: [Name] | Operator Contact: [Name]
SECTION 1 – PRIOR WEEK ACTION ITEMS
| Action Item | Owner | Due Date | Status | Notes |
| [Item from last week] | [Name] | [Date] | Closed / In Progress / Escalated |
SECTION 2 – SEVEN METRIC DASHBOARD
| Metric | This Week | Last Week | 4-Week Avg | Target | Flag? |
| Leads Worked Rate | 95%+ | ||||
| Contact Rate | [Campaign target]% | ||||
| Qualification Rate | [Campaign target]% | ||||
| Transfer-Set Rate | [Campaign target]% | ||||
| Show Rate | [Campaign target]% | ||||
| QA Score Average | 80+ | ||||
| 4-Week Trailing CPA | $[Target] |
Flag threshold definitions:
- Leads Worked Rate below 92%: flag
- Contact Rate drop greater than 2 percentage points week-over-week: flag
- Qualification Rate drop greater than 3 percentage points week-over-week: flag
- Transfer-Set Rate drop greater than 2 percentage points week-over-week: flag
- Show Rate below 65%: flag
- Any agent QA score below 72: flag
- Four-week trailing CPA increasing for three consecutive weeks: flag
SECTION 3 – AGENT-LEVEL SUMMARY
| Agent | Contact Rate | Qualification Rate | Transfers Set | QA Score | Flag? |
| Agent 1 | |||||
| Agent 2 |
SECTION 4 – VARIANCE NOTES
For each flagged metric: root cause, current status, and expected resolution date.
[Metric flagged]: [Root cause] | [Current status] | [Expected resolution date]
SECTION 5 – ACTION ITEMS
| Action Item | Owner | Due Date | Success Criterion |
SECTION 6 – FORWARD LOOK
Changes to the campaign in the coming week: [List any lead source changes, script updates, volume adjustments, agent additions, or system changes]
SECTION 7 – NOTES
Open items, context, and any items for the monthly strategic review that emerged from this week’s data.
Performance Benchmark Reference
The ranges below reflect benchmark performance for outbound campaigns in managed financial services. A campaign in its first 30 days will show more natural swings than one at steady state.
Contact Rate
- Strong: Above 28%
- Acceptable: 18–28%
- Flag for discussion: 12–18%
- Escalation required: Below 12%
Qualification Rate on Contacts
- Strong: Above 55%
- Acceptable: 38–55%
- Flag for discussion: 25–38%
- Escalation required: Below 25%
Transfer-Set Rate on Qualified
- Strong: Above 28%
- Acceptable: 18–28%
- Flag for discussion: 12–18%
- Escalation required: Below 12%
Show Rate
- Strong: Above 78%
- Acceptable: 65–78%
- Flag for discussion: 55–65%
- Escalation required: Below 55%
QA Score Average
- Strong: 85 and above
- Acceptable: 75–85
- Flag for discussion: 65–75
- Escalation required: Below 65
These are directional benchmarks, not hard rules. Every campaign sets its own baseline in the first 30 days. That baseline becomes your personal reference point.
How to Run the Review When Metrics Are Below Target
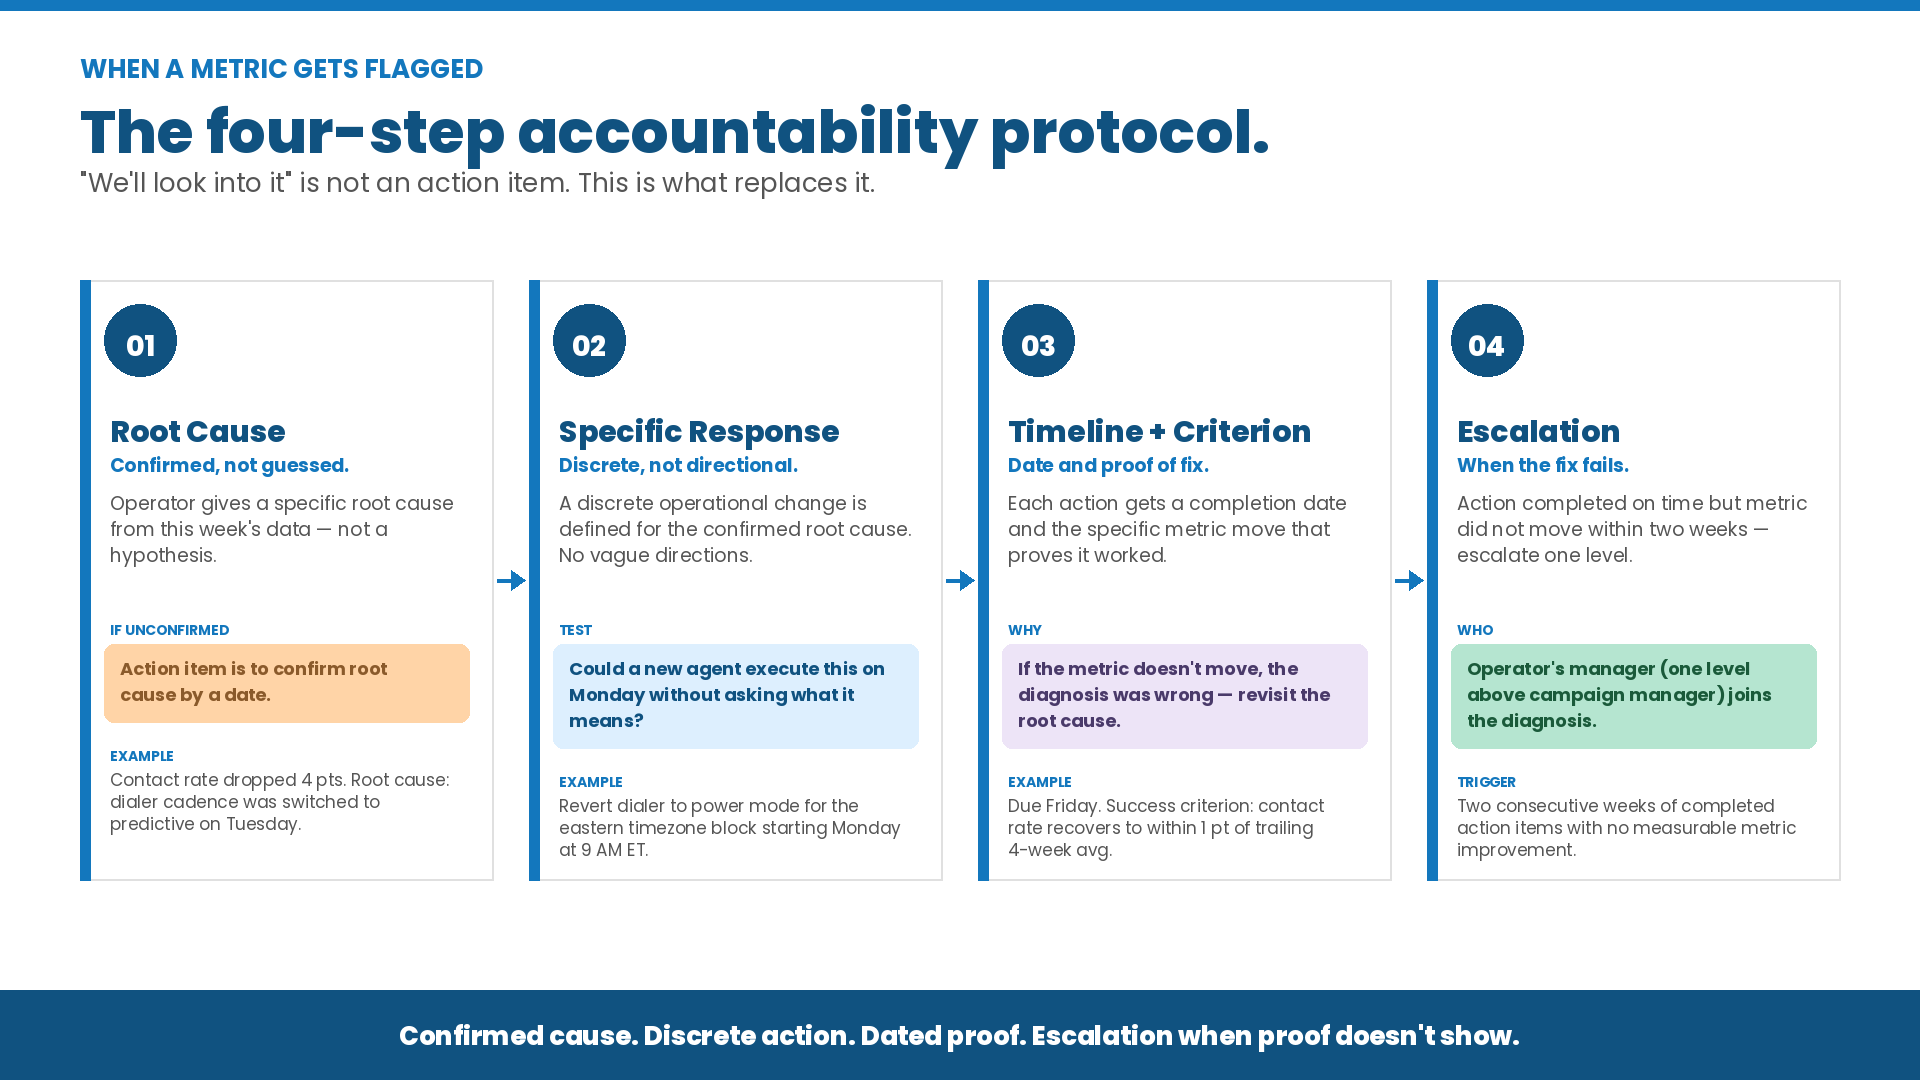
The value of the weekly review isn’t in the reporting. It’s what happens when a number is flagged. Most BPO reviews fail not because the data is wrong, but because the response to a bad number is vague.
“We’ll look into it” is not an action item.
The International Association of Outsourcing Professionals (IAOP) consistently shows that outsourcing clients who use a structured response protocol (specific actions, named owners, clear deadlines) resolve problems faster and hold performance longer than clients who rely on informal discussion.
Step 1: Root Cause Identification
Before the meeting ends, the operator gives a specific root cause: not a guess, but a confirmed diagnosis from that week’s data. If the cause hasn’t been confirmed yet, the action item is to confirm the root cause by [date].
Step 2: Specific Operational Response
For every confirmed root cause, a specific change is defined. Not a general direction. A discrete action. “Reconfigure the calling window to add the 5:30–7:30 PM eastern block” is specific. “Improve calling window strategy” is not.
Step 3: Timeline and Success Criterion
Each action item gets a completion date and the specific metric that will show it has worked. This creates a clear test: if the action doesn’t move the metric, the diagnosis was wrong and needs to be revisited.
Step 4: Escalation Protocol
If an action item is completed on time but the metric doesn’t move within two weeks, it becomes an escalation item. The operator’s manager (above the campaign manager) gets involved in the diagnosis and response.
How the Weekly Template Feeds the Monthly Strategic Review
The monthly strategic review is not a bigger version of the weekly review. It uses four weeks of weekly data as its source, but it asks different questions.
The weekly review asks: “What happened this week, and what do we do about it?”
The monthly review asks: “What do the last four weeks tell us about the campaign’s direction, lead source quality, and what should change in the next 30 days?”
Monthly review agenda:
- Four-week trend analysis: each of the seven metrics across all four weeks. Where are the trends pointing?
- Lead source review: contact rate, qualification rate, and close rate by lead source for the full month. Which sources produce the best cost per close?
- Agent performance review: QA score trends, contact rate, and transfer quality by agent for the full month. Who improved? Who declined despite coaching?
- Next 30-day plan: volume targets, campaign changes, lead source shifts, and script or criteria updates for the next period
The monthly review sets the strategy. The weekly review manages execution. You need both. Neither replaces the other.