
Every Monday, the same report shows up. The BPO vendor sends a dashboard. Contact rate: 24%. Transfer-set rate: 18%. The account manager calls it a strong week. The closer team closed nine deals. But is nine good or bad? The show rate was never shared. The close rate on the shown transfers was never broken out. That 18% may include calls that were pushed through just to hit a number.
Deloitte’s Global Outsourcing Survey found that 70% of executives report their vendor management function is not yet fully mature, meaning most companies lack the structure to measure true vendor performance. A 2025 Everest Group analysis found that most BPO contracts still rely on traditional SLAs measuring process efficiency rather than tying KPIs to real business outcomes. The gap between what is reported and what is actually produced is where most vendor problems start.
This guide closes that gap. Every metric in the live transfer chain is defined below. Clear benchmarks are set for financial services. A step-by-step framework is provided for holding any BPO vendor to account through the contract, weekly reviews, and monthly check-ins.

The Full BPO Performance Metric Stack: How They Connect
Before looking at transfer-set rate and show rate on their own, it helps to see where they fit in the bigger picture. No single metric tells the full story. Each one only makes sense when compared to the steps before and after it.
Here is the full conversion chain for an outbound live transfer campaign:
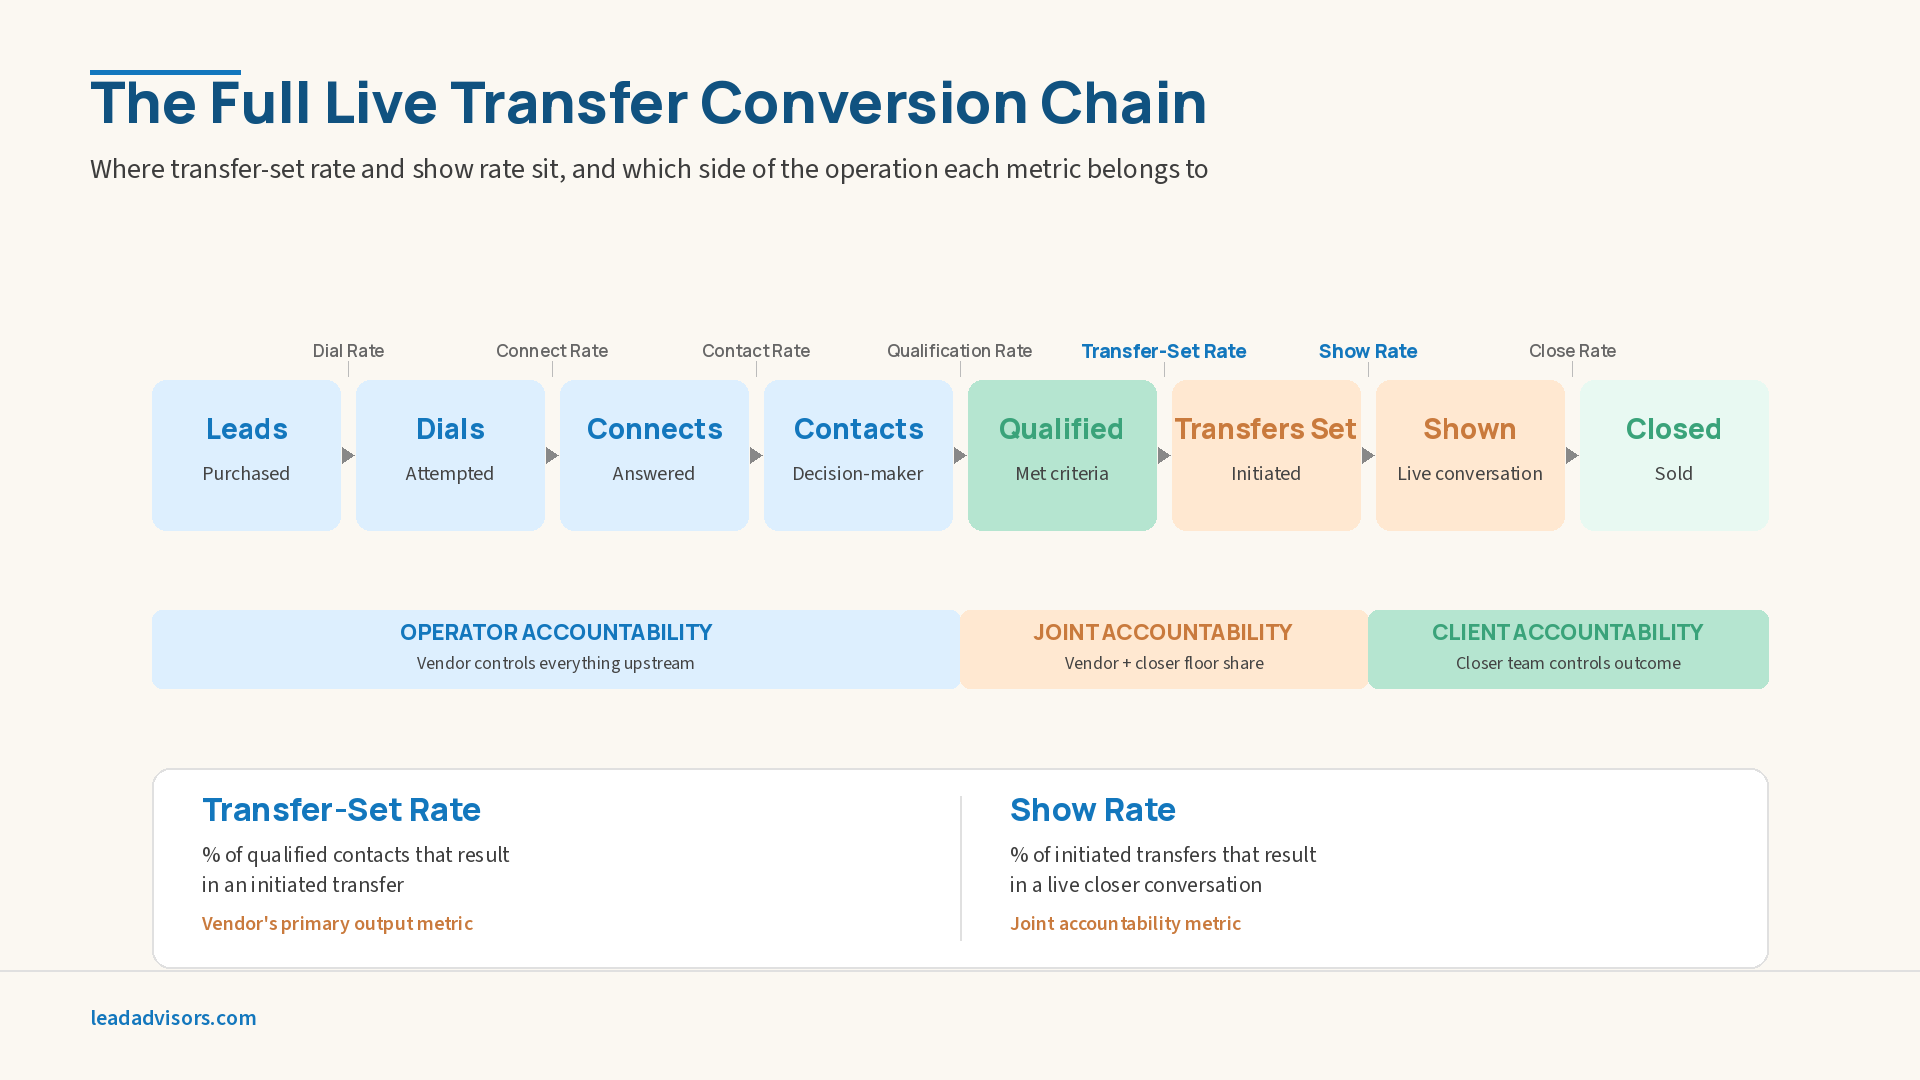
Leads Purchased → Dials → Connects → Contacts → Qualifications → Transfers Set → Transfers Shown → Transfers Closed
Each step has its own conversion rate, its own benchmark, and its own warning sign when results drop. A 2025 ICMI State of the Contact Center report found that most contact centers track only a handful of operational metrics: 85% measure abandonment rate and 84% monitor handle time, while the metrics that reveal real performance gaps are often left out.
Here are the metrics that matter at each stage:
| Stage | Metric | What Is Measured |
| Leads → Dials | Dial rate | The percentage of purchased leads that were actually dialed |
| Dials → Connects | Connect rate | The percentage of dials that resulted in an answered call |
| Connects → Contacts | Contact rate | The percentage of dials that resulted in a live decision-maker conversation |
| Contacts → Qualifications | Qualification rate | The percentage of contacts that met the defined campaign criteria |
| Qualifications → Transfers Set | Transfer-set rate | The percentage of qualified contacts that were successfully transferred |
| Transfers Set → Transfers Shown | Show rate | The percentage of set transfers that resulted in a live closer conversation |
| Transfers Shown → Transfers Closed | Close rate | The percentage of shown transfers that resulted in a sale |
The transfer-set rate and the show rate sit right in the middle. The operator owns everything before the transfer-set rate. The closer team owns everything after the show rate. These two metrics are where most vendor disputes happen. They are also where clear definitions matter most.
Transfer-Set Rate, Definition, Calculation, and What It Actually Measures
Quick answer: The transfer-set rate is the share of qualified contacts that result in a live transfer attempt. It is the operator’s main output metric.
How Transfer-Set Rate Is Calculated
The formula is simple:
Transfer-Set Rate = Transfers Initiated ÷ Qualified Contacts × 100
A transfer is “initiated” when the qualifying agent sends the prospect to the closer through the dialer. For a full look at how live transfer campaigns work, see the Ultimate Guide to Live Transfer Leads. What happens next, whether the closer picks up, the prospect stays on the line, or a real talk happens, is tracked by show rate, not transfer-set rate.
Why the Definition Matters
The word “set” means the transfer was started. It does not mean a conversation took place. This is where vendor reports can be misleading.
When a vendor reports a transfer-set rate, they indicate how many transfers were attempted. If the closer missed the call, the prospect hung up, or the call hit voicemail, none of that shows up in the number.
This creates a risky blind spot when only one metric is tracked:
- Vendor A, 22% transfer-set rate, 45% show rate → 9.9 live talks per 100 qualified contacts
- Vendor B, 30% transfer-set rate, 30% show rate → 9.0 live talks per 100 qualified contacts
Vendor B looks better on paper. But Vendor A puts more real conversations in front of the closer team. The ContactBabel US Contact Center Verticals: Outsourcing Report, published by NICE and based on 13 years of survey data from hundreds of contact centers, confirms that this kind of mismatch is widespread in outsourced programs that track transfer volume without measuring show rate.
Transfer-Set Rate Benchmarks by Vertical
These benchmarks come from financial services live transfer campaigns:
| Vertical | Below Benchmark | Acceptable | Strong |
| Debt Settlement | Below 15% | 15–22% | 22–30%+ |
| Tax Relief | Below 12% | 12–20% | 20–28%+ |
| Mortgage / Refi | Below 18% | 18–25% | 25–35%+ |
| Insurance | Below 14% | 14–22% | 22–30%+ |
When the transfer-set rate falls below the benchmark, the problem is usually with the qualifying process. Either prospects are being pushed through too easily to meet volume targets, or good prospects are being turned away because the rules are unclear. For a closer look at how qualification type affects results, see Lead Qualification: 7 Types of Live Transfer Leads That Convert.
Show Rate, Definition, Calculation, and Why It Is the Most Important Metric
Quick answer: Show rate is the percentage of started transfers that result in a real conversation between the prospect and the closer. It tells you how many conversations your sales floor actually gets.
How Show Rate Is Calculated
Show Rate = Live Transfer Conversations ÷ Transfers Initiated × 100
A transfer “shows” when the prospect stays on the line, the closer picks up, and they start talking. If the prospect hangs up during the hold, the call goes to voicemail, or no closer is free, it counts as a set transfer that did not show.
Why the Show Rate Is More Important
The show rate tracks what the closer team actually gets. The transfer-set rate only tracks what the vendor attempted to send. Show rate is what drives daily conversations, closes, and revenue.
A 2025 ICMI report on evolving contact center metrics found that only 38% of contact centers measure outcomes beyond basic efficiency metrics, with most relying on volume-based metrics that mask quality issues. When the show rate is hidden, transfer quality problems stay buried inside good-looking transfer-set rate numbers.
What Drives the Show Rate Up or Down
Two groups of factors affect the show rate:
Vendor-side factors:
- How smoothly the handoff is run
- How long the prospect waits on hold
- Whether the real interest was confirmed before the transfer was started
- McKinsey & Company research on contact center performance found that only 38% of contact center agents are extremely satisfied with their jobs, and satisfaction drops sharply under volume pressure. When agents are pressured to hit transfer volume, low-intent prospects get pushed through, and show rates drop as a result.
Client-side factors:
- Whether a closer is free when the transfer comes in. For tips on getting closers ready, see How to Train Closers to Receive Warm Transfers.
- Whether closer schedules line up with the hours the qualifying floor is active
- When no closer is free, the call drops or goes to voicemail. It still counts as a set transfer but creates zero value.
Show Rate Benchmarks by Vertical
| Vertical | Below Benchmark | Acceptable | Strong |
| Debt Settlement | Below 55% | 55–70% | 70–85%+ |
| Tax Relief | Below 50% | 50–65% | 65–80%+ |
| Mortgage / Refi | Below 60% | 60–75% | 75–85%+ |
| Insurance | Below 55% | 55–70% | 70–82%+ |
When show rates drop below 55%, there is usually a problem on the vendor side, the client side, or both.
The Metric That Combines Both, the Effective Transfer Rate
Quick answer: The effective transfer rate is the number of live talks per 100 qualified contacts. Multiply the transfer-set rate by the show rate to get it.
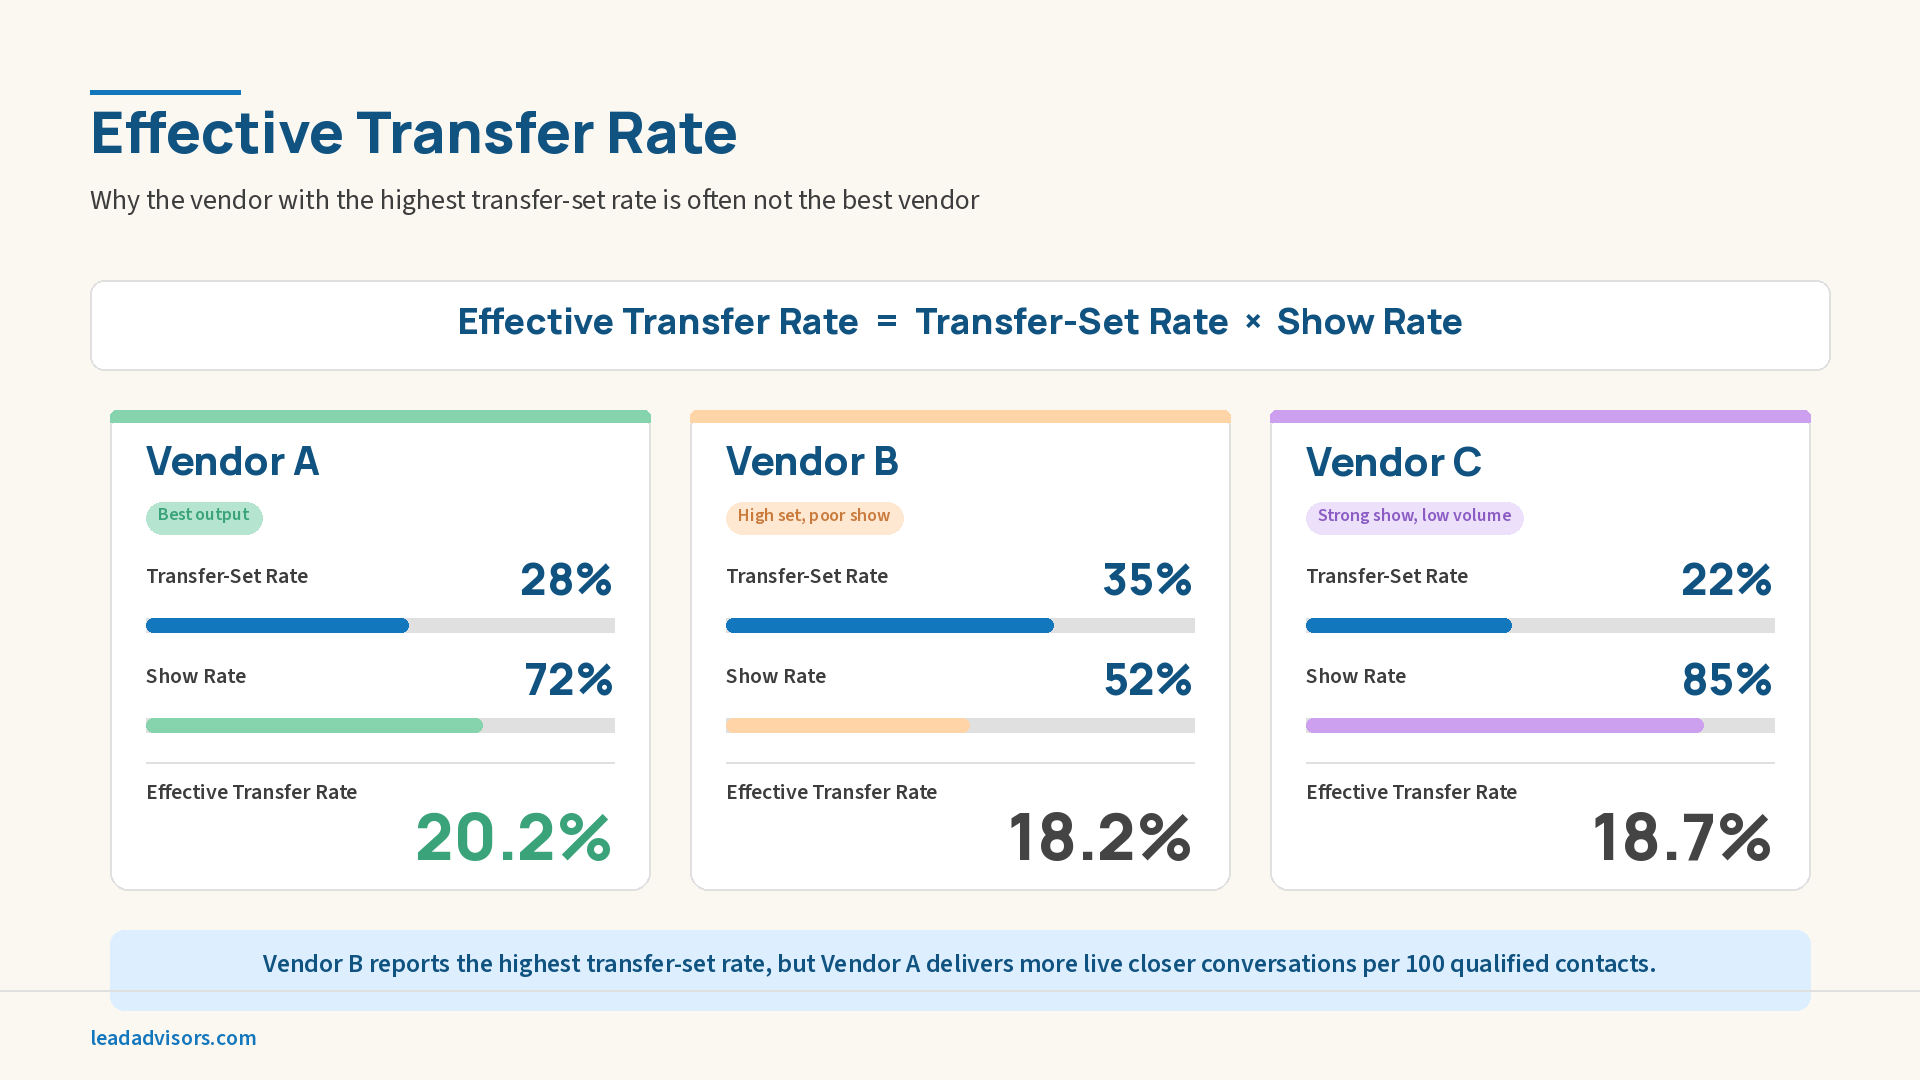
Effective Transfer Rate = Transfer-Set Rate × Show Rate
This metric answers the question that matters most: for every 100 qualified contacts, how many turn into a real conversation with a closer?
| Scenario | Transfer-Set Rate | Show Rate | Effective Transfer Rate |
| Vendor A | 28% | 72% | 20.2% |
| Vendor B | 35% | 52% | 18.2% |
| Vendor C | 22% | 85% | 18.7% |
Vendor B has the best transfer-set rate. But Vendor A delivers more real conversations. If you only compare the transfer-set rate, you pick Vendor B, but you end up with fewer live talks.
Bain & Company’s research on outsourcing performance found that leading companies now focus on combined outcome metrics rather than single operational KPIs when evaluating vendors. The reason is simple: you cannot game it. Both transfer-set rate and show rate must be strong for the combined number to look good.
What to do with this metric:
- Track it every week.
- Compare it across vendors.
- Use it as the main number in every vendor review.
The Five Metrics Every BPO Live Transfer Vendor Should Report, And the Three They Try to Avoid
Most vendor reports are built to highlight strengths and hide weaknesses. ISG’s quarterly Enterprise CX Insights reports, based on feedback from over 300 organizations, consistently flag governance and data transparency as top concerns, with many enterprise clients reporting gaps in the data needed to evaluate vendor performance.
Pay attention to what a vendor shares on their own and what you have to ask for. That tells you more than any contract or reference call.
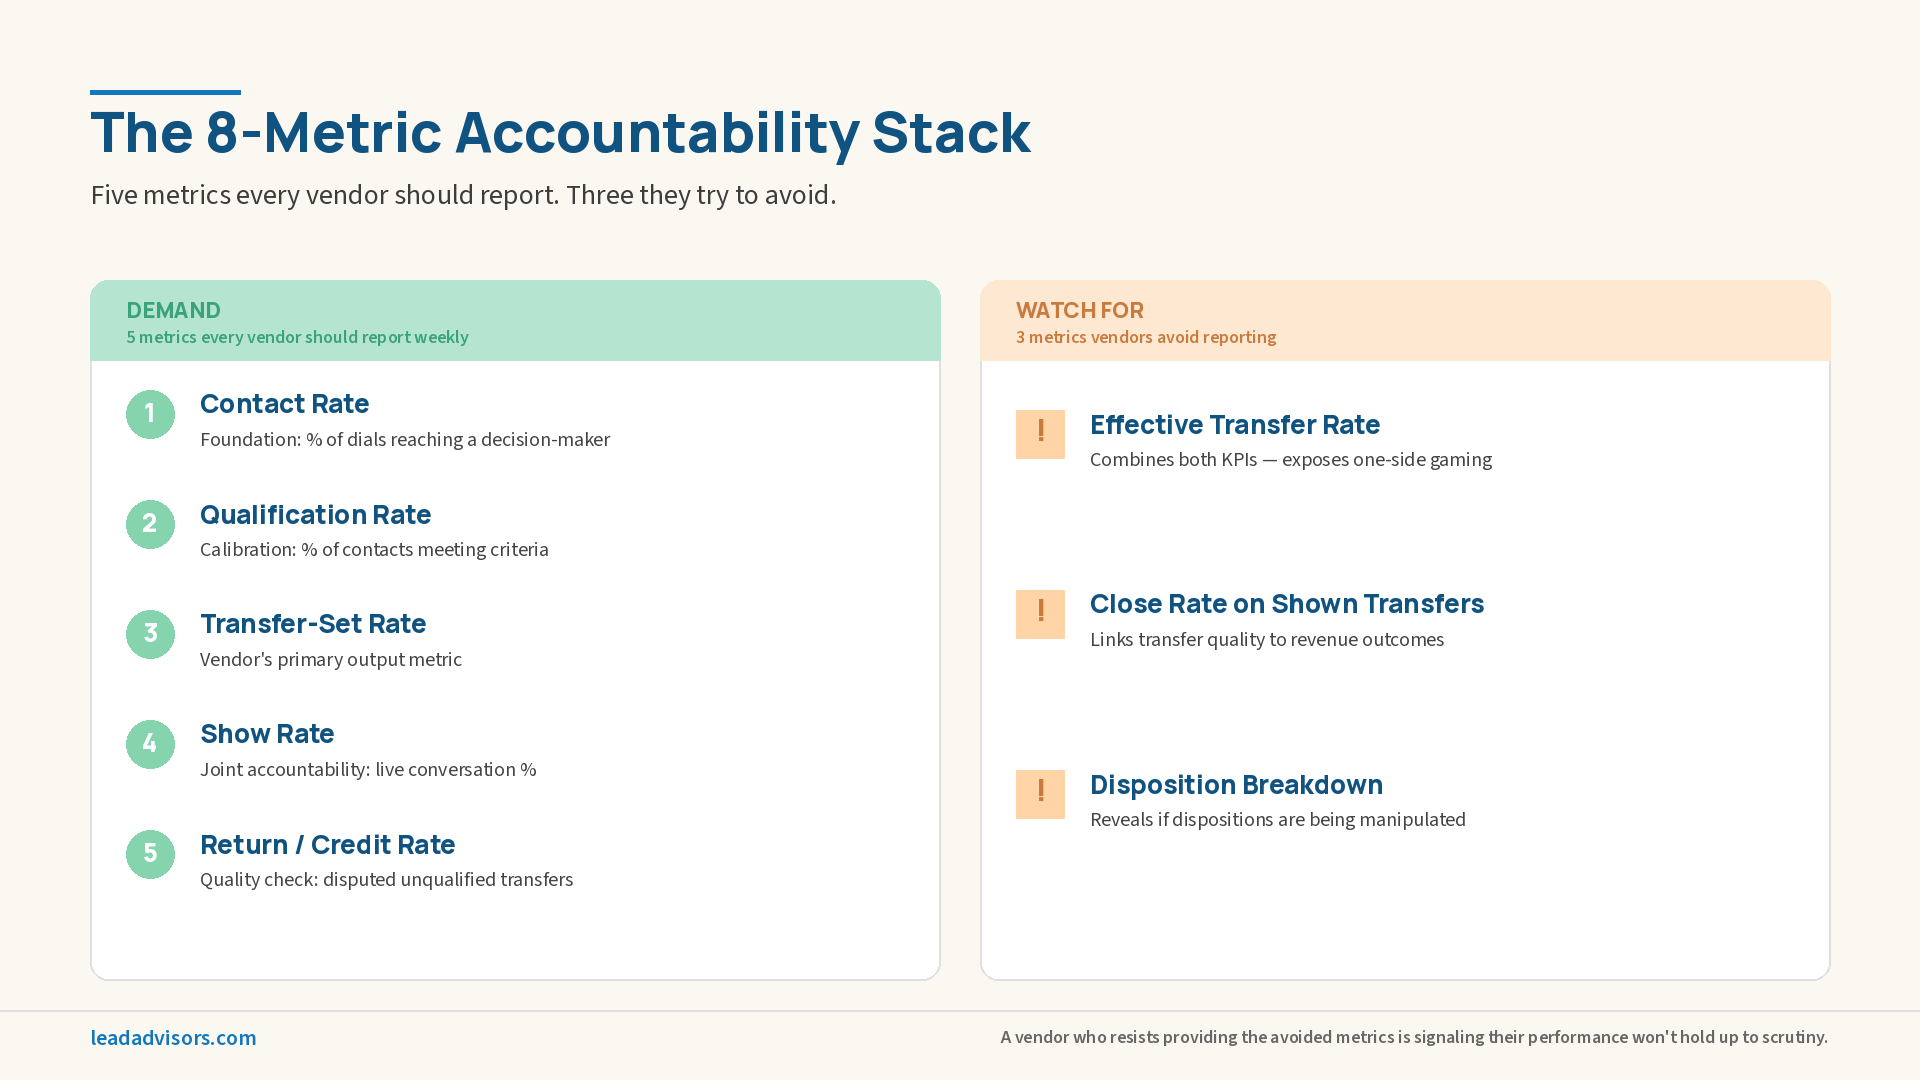
The Five Metrics That Should Be Reported Weekly
- Contact rate. The share of dialed leads that resulted in a live conversation with a decision-maker. This is the vendor’s core job. If it is not reported, the most basic duty is to hide it.
- Qualification rate. The share of contacts that met the campaign rules and moved to the transfer queue. Too high means loose rules. Too low means the rules are too strict or agents are not qualifying well.
- Transfer-set rate. The share of qualified contacts that led to a transfer attempt. This is the vendor’s main output number.
- Show rate. The shared metric. Low show rate on the vendor side points to transfer quality issues. A low show rate on the client side indicates broader staffing gaps.
- Return/credit rate. The share of set transfers that the client disputed. A high transfer-set rate paired with a high return rate means unqualified prospects are being pushed through.
The Three Metrics That Are Often Avoided
- Effective transfer rate. Vendors avoid it because it combines the transfer-set rate and show rate into a single number. That makes it easy to compare vendors side by side.
- Close rate on shown transfers. Vendors avoid it because it links their quality of qualification to the client’s close results. Loose qualifying gets exposed fast.
- Disposition breakdown on unqualified contacts. This shows why contacts were turned away (below the debt threshold, in bankruptcy, not a decision-maker, not interested, or the wrong contact). It gets hidden because it reveals whether rules are being followed or gamed.
Ask for all eight. Report all eight every week. Any vendor that pushes back on the three avoided metrics is telling you their numbers would not look good.
How to Build a Live Transfer KPI Contract: The Accountability Language
These metrics serve only as tools to hold vendors to account when written into the contract. That means clear targets, clear math, and clear consequences. Research from the Wharton School at the University of Pennsylvania identified failure to define specific, measurable performance metrics as one of the two most costly errors in outsourcing, leading to service breakdowns that contracts with clear KPI targets could have prevented.
Defined Metrics With Agreed Calculation Method
The contract should spell out how each metric is calculated. Here is an example:
“Transfer-set rate is the number of transfers started by qualifying agents divided by the number of qualified contacts confirmed against Schedule A, shown as a percentage. A transfer is ‘started’ when the qualifying agent uses the dialer transfer function and the call connects to the client’s transfer line.”
The definition matters just as much as the target. If “qualified contact” is defined loosely, any target can be hit by pushing unqualified prospects through.
Defined Benchmark Targets
Set minimum numbers for the transfer-set rate and show the rate vertically. These are not goals. They are floors. When results drop below them, the response plan kicks in.
Example: “Transfer-set rate shall not fall below 18% in any rolling 30-day period. Show rate shall not fall below 62% in any rolling 30-day period.”
Defined Measurement Period
Use a rolling 30-day window. This prevents a single bad week from triggering penalties. It also prevents a vendor from hiding a bad month behind a single strong week. IAOP’s Outsourcing Standards Board recommends well-defined measurement frameworks as part of its professional standards for outsourcing governance. A rolling 30-day window is the fairest approach because it gives vendors time to ramp while still catching real problems.
Defined Response to Underperformance
Here is a sample contract language:
“If transfer-set rate falls below the minimum in any rolling 30-day period, the operator must provide a written root cause report and an action plan within 5 business days. The plan must include specific changes to the qualifying script, agent assignments, or call cadence. If results do not return to benchmark within 15 days, the client may request a credit equal to [X]% of management fees for that period.”
Return and Credit Policy
“Transfers that the client finds did not meet the criteria in Schedule A will be credited at the per-transfer rate within [X] business days of a written dispute, as long as the dispute is filed within 48 hours of the transfer.”
Benchmarking Your Current Vendor: A 30-Day Audit
If a BPO vendor is running live transfers right now and the actual show rate is unknown, this five-step audit will find it. No special tools are needed.
Step 1: Pull the Raw Transfer Log
Ask the vendor for a full transfer log from the last 30 days. It should list every transfer attempt with a timestamp, prospect ID, result (completed, failed, or dropped), and call length. If the vendor cannot send this in a simple export, that is the first red flag.
Step 2: Match It Against the Closer Team’s CRM
Compare the vendor’s log to the closer team’s CRM. Look for transfers that appear as received calls lasting more than 60 seconds. Any transfer in the vendor’s log that does not appear in the CRM is a transfer that did not show. That gap is the show rate problem.
Step 3: Calculate Effective Transfer Rate
Divide the shown transfers (in both logs) by the qualified contacts (from the vendor’s report). That gives the effective transfer rate. Compare it to the benchmarks in this post.
Step 4: Calculate Return Rate
Count how many shown transfers led to a return or credit request. Divide that by the total shown transfers. That is the return rate. APQC’s Contact Center Key Benchmarks, based on cross-industry performance data, provide standard KPI ranges for evaluating contact center operations. Return rates above 12-15% typically indicate a systematic issue with the accuracy of qualifying.
Step 5: Bring the Numbers to the Vendor
Share the effective transfer rate and return rate with the vendor’s account manager. Include the benchmark comparison. Ask for a written response that names the exact causes of any metric that fell short, along with a timeline for fixing it.
A vendor that provides vague answers rather than clear explanations is not being transparent enough for a managed BPO relationship.
How Show Rate and Transfer-Set Rate Connect to CPA
The transfer-set rate and the show rate are process numbers. Cost per acquisition (CPA) is the cost per acquisition. When they are linked, the KPI talk becomes a revenue talk. It becomes clear how a 10-point boost in show rate turns into real dollars.
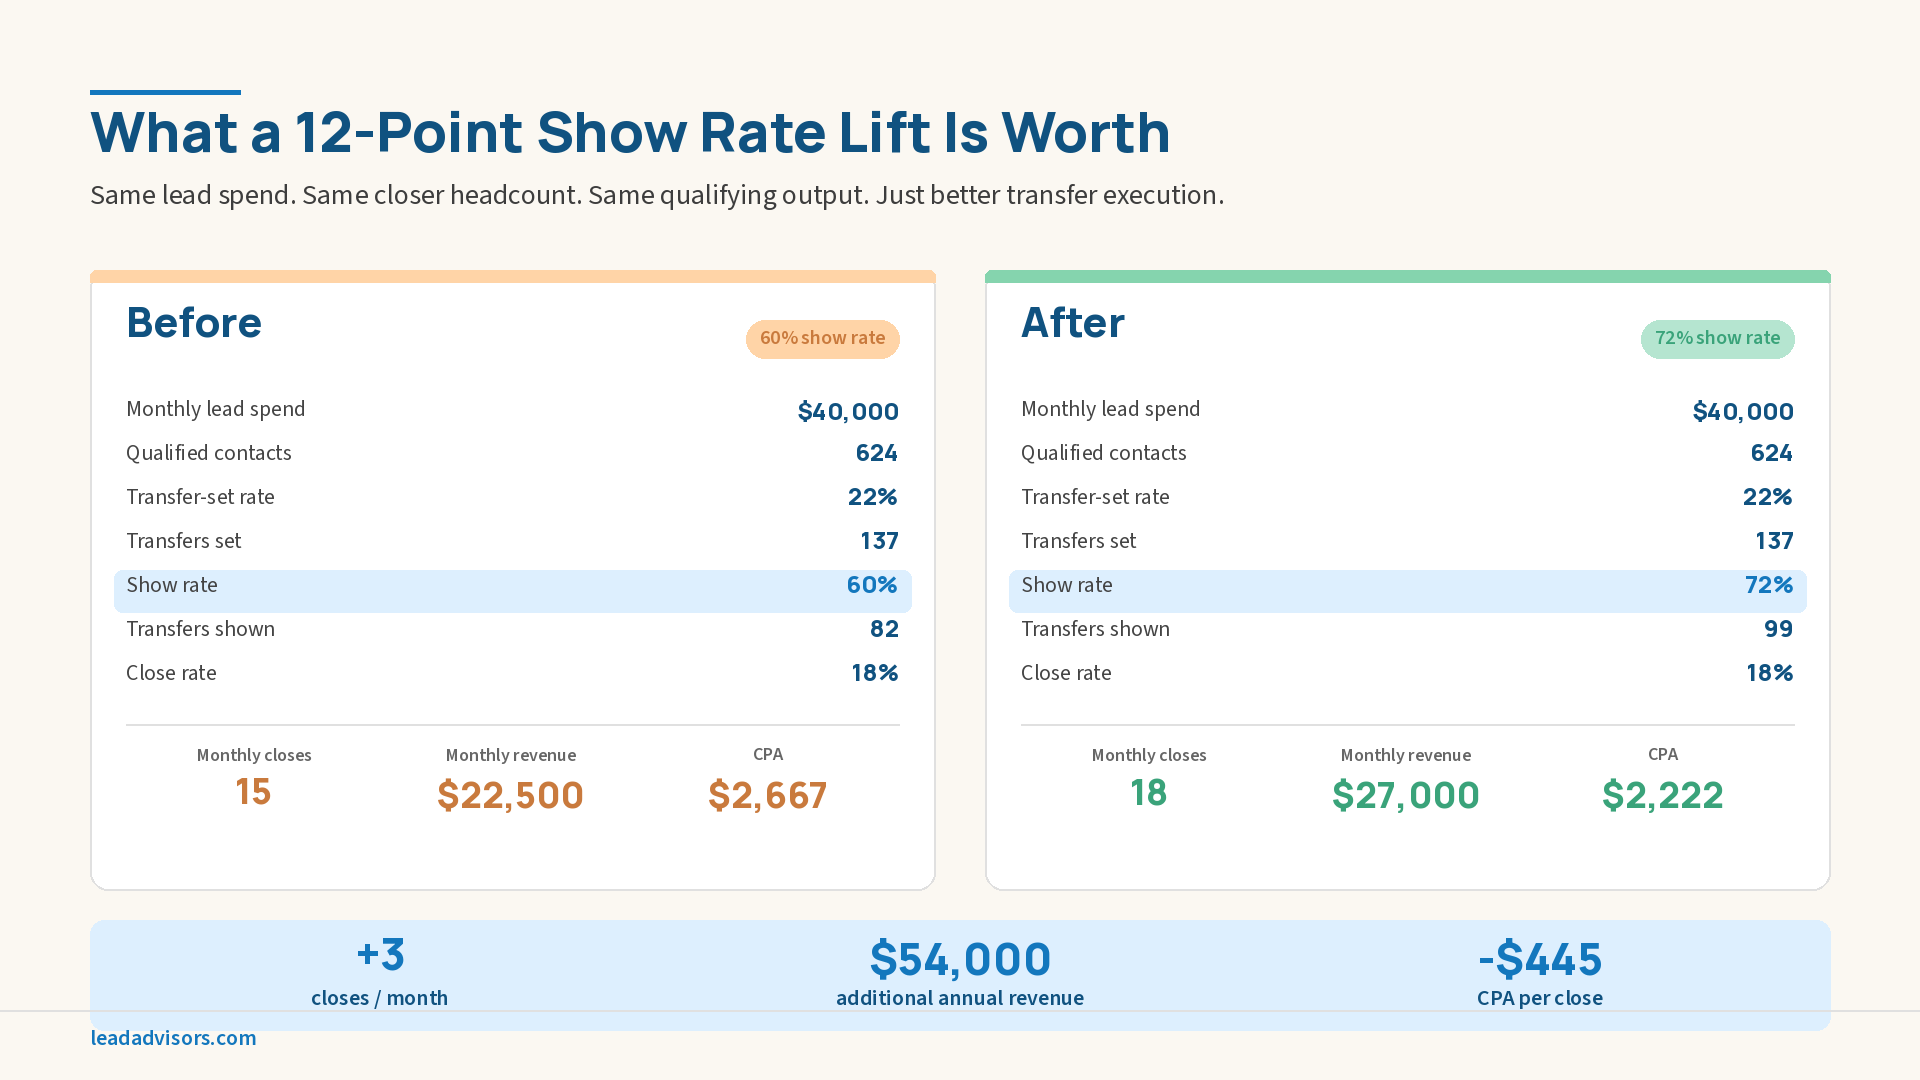
The Math: A Debt Settlement Floor Example
| Metric | Baseline (60% Show Rate) | Improved (72% Show Rate) |
| Monthly lead spend | $40,000 | $40,000 |
| Cost per lead | $10 | $10 |
| Leads purchased | 4,000 | 4,000 |
| Contact rate | 24% | 24% |
| Contacts | 960 | 960 |
| Qualification rate | 65% | 65% |
| Qualified contacts | 624 | 624 |
| Transfer-set rate | 22% | 22% |
| Transfers set | 137 | 137 |
| Show rate | 60% | 72% |
| Transfers shown | 82 | 99 |
| Close rate | 18% | 18% |
| Monthly closes | 15 | 18 |
| Revenue per close | $1,500 | $1,500 |
| Monthly revenue | $22,500 | $27,000 |
| CPA | $2,667 | $2,222 |
Key takeaways from this model:
- A 12-point jump in show rate (60% to 72%) adds 3 more closes per month
- CPA drops by $445 with no extra spend, no new hires, and no change to the qualifying team
- Over a full year: 36 extra closings worth $54,000 in added revenue from one fix
Bain & Company research found that transformational outsourcing delivers up to 25% improvement in total cost of ownership when companies shift from transactional metrics to outcome-aligned KPIs. Improving show rate targets the outcome that matters most: real conversations that drive revenue.
This is not an abstract KPI talk. It is a money talk. Every point of the show rate has a dollar value.
KPIs Beyond Transfer-Set Rate and Show Rate: The Full Accountability Stack
The transfer-set rate and the show rate are the two most important metrics in a live transfer campaign. But they do not work alone. The full stack includes the metrics above and below to provide the complete picture.
Upstream Metrics (Operator Accountability)
- Dial rate. The share of purchased leads that were actually called. If the dial rate drops below 90%, leads are sitting in the queue unworked. Or they are being left out of the dialing pool without the client knowing.
- Contact rate. The base metric that feeds everything else. Low contact rate before qualifying points to a setup problem, as covered in Contact Rate Optimization: How to Fix Low Outbound Performance. A low qualifying rate on high-contact-rate points points to a script or criteria problem.
- Average handle time (AHT) on qualifying calls. The average length of qualifying talks that end in a transfer. If AHT stays under 2 minutes on a strict campaign, agents are likely skipping parts of the script to hit volume. More detail on this metric is in Average Handle Time (AHT): Optimize Efficiency Without Sacrificing Quality. MIT Sloan Management Review research on business process outsourcing found that the most successful outsourcing contracts evaluate processes across multiple quality dimensions rather than focusing solely on speed, and that cutting steps to boost volume leads to higher downstream failure rates.
Downstream Metrics (Shared Accountability)
- Close rate on shown transfers. The share of shown transfers that close. This metric links transfer quality (the vendor’s job) to closer skill (the client’s job). If the close rate is low, even though closers do well on other lead types, the transfers are the problem. For a related guide, see How to Measure, Improve, and Master First Call Resolution (FCR).
- Revenue per transfer. Total revenue divided by the total number of shown transfers. This is the bottom-line metric. It rolls up close rate, revenue per close, and show rate into a single number. It shows the dollar value of each transfer the vendor sends to the closer team.
Track all of these together. Report them as a set. The full stack shows both sides: where results are strong and where they fall short.