
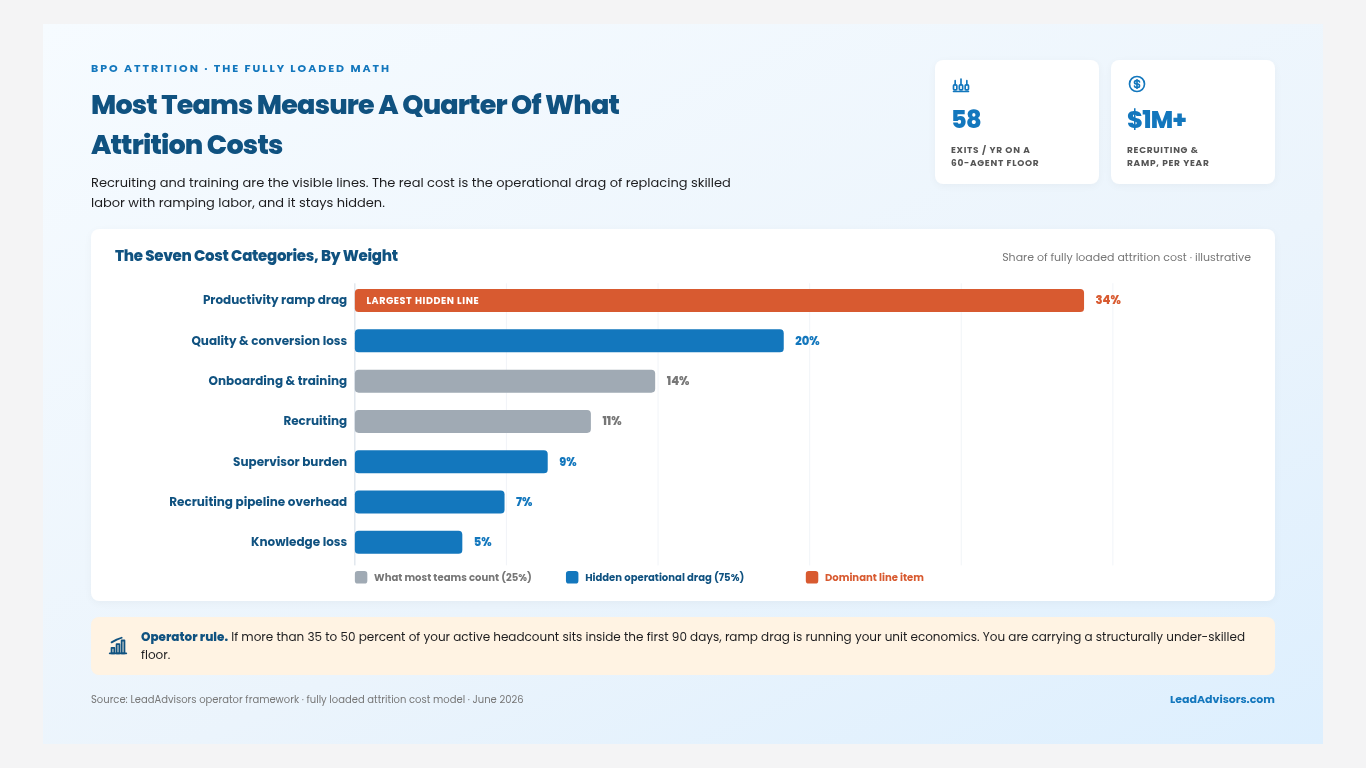
You think your 8 percent monthly attrition is normal. Then the year ends, and the math exposes the truth. A 60-agent operation that loses 58 people annually spends over $1 million on recruiting and ramp, while conversion tanks because nearly half your floor is permanently in their first 90 days.
This is not an HR problem. It is the highest hidden cost in your operation. Most managers track the wrong metrics, calculate costs incompletely, and apply interventions that treat symptoms rather than the disease. Recruiting harder, raising pay, and adding perks will not stop the churn if your structural foundation is broken.
BPO attrition in 2026 is an infrastructure failure. Operators who fix the underlying system compress their fully loaded costs and drive higher conversion. This guide delivers the framework to bring your attrition under control by measuring the right data, calculating true costs, and applying a targeted intervention system.

What Is BPO Agent Attrition (And Why It Hits Call Centers Harder Than Most Teams)
Agent attrition is the rate at which agents leave your operation and must be replaced. In call centers, attrition concentrates because the work has structural characteristics:
- repetitive work cycles
- emotionally charged conversations
- high monitoring and strict compliance language
- unpredictable volume swings
Academic and research literature regularly describes contact center work as high-pressure and emotionally demanding, which helps explain why turnover remains structurally high even when wages rise, as described in an NBER working paper.
The operator impact: In specialized environments (financial services outbound, regulated verticals, complex scripts), attrition is not just a replacement problem. It is a performance problem because skill takes time to build.
How To Measure Call Center Attrition (Because Most Operators Measure It Wrong)
Most teams track one attrition number. That number rarely tells you what to fix.
Method 1: Simple Annualized Attrition (The Headline Number)
Formula: separations during period ÷ average headcount during period, then annualize.
What it’s good for:
- communicating scale to leadership
- comparing periods at a high level
What it misses:
- When agents are leaving (which tells you what broke)
Method 2: Tenure-Bucketed Attrition (The Diagnostic You Actually Need)
Break separations into tenure buckets at the time of exit:
- 0 to 30 days
- 31 to 90 days
- 91 to 180 days
- 181 to 365 days
- 365+ days
Then calculate attrition inside each bucket.
What it reveals:
- 0 to 60-day churn is typically a selection or expectation-setting failure.
- 30 to 90-day churn is typically an onboarding capacity and ramp-target failure.
- 90 to 365-day churn is typically a coaching or compensation progression failure.
Method 3: Cohort Retention Curves (The Proof Your Fix Worked)
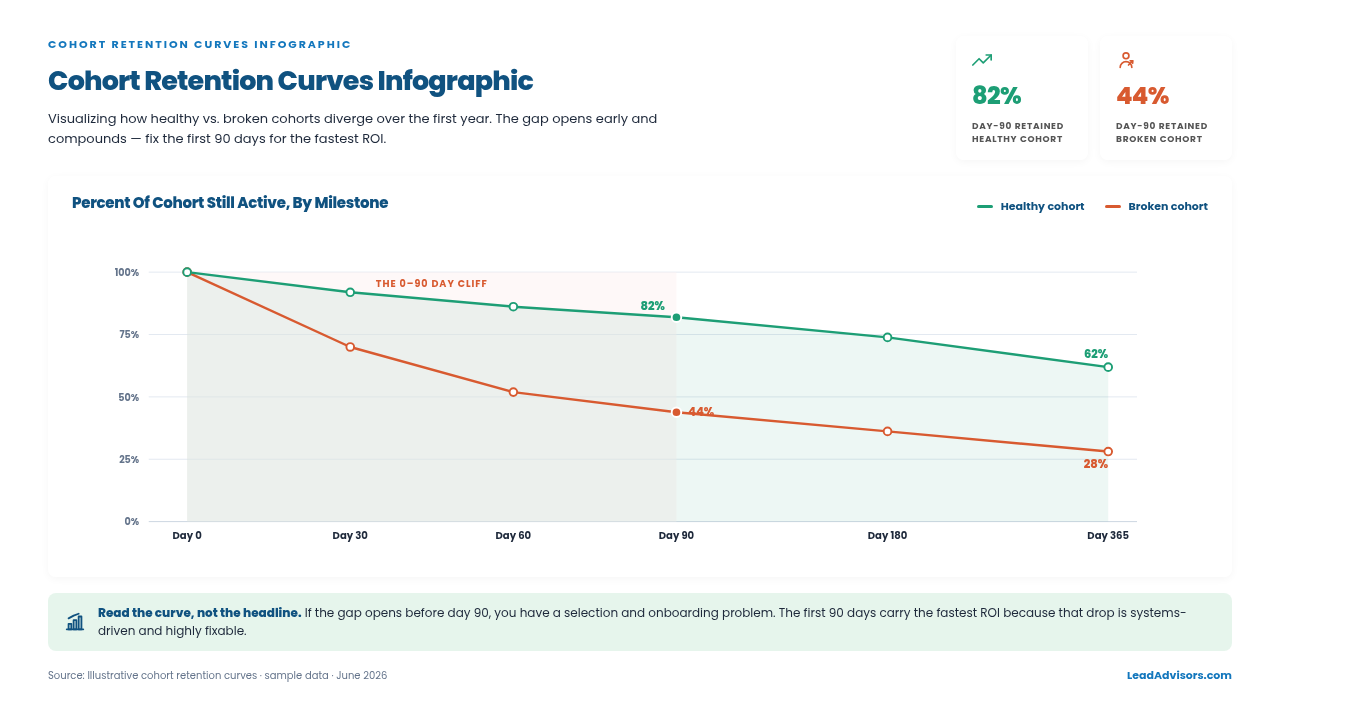
Track every hire cohort (usually by month) through retention milestones:
- day 30
- day 60
- day 90
- day 180
- day 365
This stops the most common leadership mistake: celebrating a temporary drop in annualized attrition that simply shifted exit timing by a few weeks.
Why Measurement Determines The Intervention
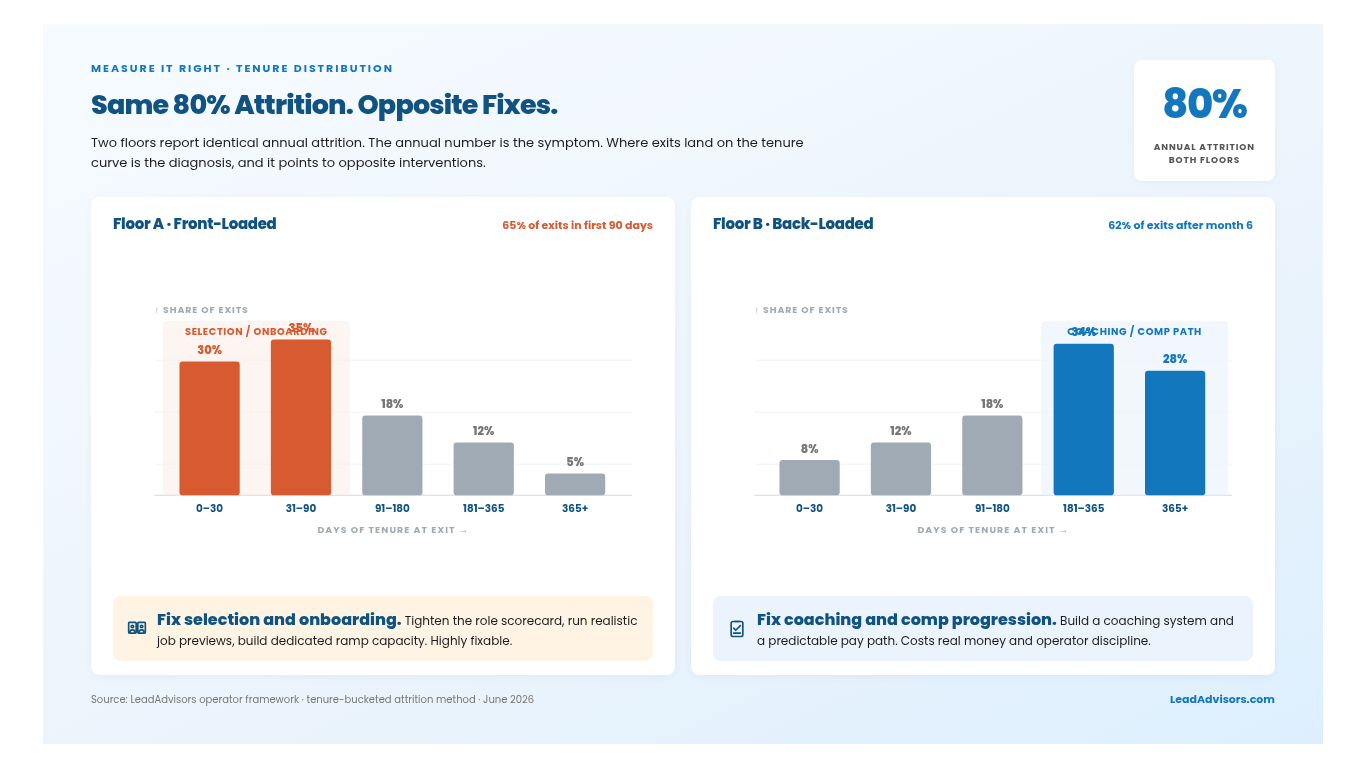
Two floors can both report “80 percent annual attrition” and require opposite fixes:
- Floor A loses most agents in days 0 to 90. Fix selection and onboarding.
- Floor B loses most agents in months 9 to 14. Fix coaching and compensation progression.
Annualized attrition tells you the symptom. Tenure distribution tells you the cause layer.
What Call Center Attrition Actually Costs (The Fully Loaded Math)
Many teams count only recruiting spend and training time. That is not the cost. The cost is the operational drag created by replacing skilled labor with ramping labor.
Below is a fully loaded model you can apply to any call center, inbound or outbound.
If you want the deeper cost accounting model that ties labor cost to unit economics, read the loaded cost of a call center agent and use it as the baseline for your attrition math.
A Simple Attrition Cost Calculator (Inputs You Can Pull This Week)
You do not need a finance team to model attrition cost. You need consistent inputs.
Inputs
- Average active headcount: total staffed agents on an average day
- Annual separations: total agents who exited in the last 12 months
- Average time to proficiency: number of days to hit quality and conversion benchmarks
- Ramp curve: expected output at day 30, 60, 90, 180
- Average weekly hours per agent
- Value per productive hour (pick one)
- revenue per productive hour (sales floors)
- gross margin per productive hour
- avoided cost per productive hour (support floors measured by SLA and overflow cost)
Outputs
- Replacement volume: separations per year
- Ramp drag hours: replacement volume × (time to proficiency) × (productivity gap)
- Ramp drag cost: ramp drag hours × value per productive hour
Operator rule: The goal is not perfect precision. The goal is to stop undercounting by only measuring recruiting and training.
Category 1: Recruiting Cost
This includes:
- recruiter time
- job board spend
- screening tooling
- agency fees were used
Category 2: Onboarding And Training Cost
This includes:
- trainer time
- new hire wages, while not producing
- training materials and QA time during training
- supervisor time pulled into onboarding cycles
Category 3: Productivity Ramp Cost (The Largest Hidden Line)
In specialized programs, agents ramp over 60 to 180 days. During the ramp, output is below the benchmark. That output delta is the real cost.
Operator rule: If more than 35 to 50 percent of your active headcount is inside the first 90 days, ramp drag is dominating your unit economics. You are running a floor that is structurally under-skilled.
Example: Ramp Drag Without Using Any Sensitive Numbers
If a floor replaces 40 agents per year and the average new agent operates at a 50 percent productivity gap for 90 days, your operation is effectively carrying a permanent “hidden vacancy” even when every seat is filled. That vacancy shows up as:
- lower daily output
- missed dials, missed connects, missed transfers
- increased queue time or SLA risk on support programs
This is why churn feels like a performance problem, not just a hiring problem.
If your ramp time is long because the call types are complex, align your curriculum to a structured call center training guide for 2026 so performance targets ramp in stages instead of collapsing agents in week two.
Category 4: Quality And Conversion Cost
New agents:
- miss compliance language
- fail QA more often
- mishandle objections
- create more escalations
This cost rarely shows up as “attrition cost.” It shows up as:
- “Lead quality got worse”
- “The campaign is underperforming”
- “Close rate is down”
What To Track (So You Can Prove Attrition Is The Root Cause)
Track these metrics by tenure bucket:
- conversion rate by tenure
- QA pass rate by tenure
- average handle time by tenure (inbound)
- escalation rate by tenure
- compliance findings by tenure
When you see performance gaps converge after day 90 or day 180, you have your ramp curve. That curve is the cost model.
Category 5: Supervisor Burden Cost
High churn consumes supervisor bandwidth. Supervisors spend more time on:
- attendance enforcement
- side-by-side support
- retraining and recertification
Less time remains for coaching tenured agents.
Category 6: Recruiting Pipeline Overhead
A high-attrition floor requires constant sourcing. That inflates:
- recruiter headcount
- sourcing tooling
- hiring ops overhead
Category 7: Knowledge Loss Cost
In client-specific BPO programs, knowledge loss is material:
- vertical nuance
- script and offer pattern recognition
- objections by segment
- client process fluency
Section close: If you are not tracking ramp drag and conversion delta by tenure, you are not tracking attrition cost. You are tracking recruiting expenses.
The Structural Causes of Call Center Attrition (And Which Ones Are Fixable)
Attrition is produced by systems. The system shows up in your tenure buckets.
Cause 1: Wrong Hire (0 To 60 Day Attrition)
What it looks like:
- Agents churn before they ever become productive
- You keep hiring “more of the same,” and churn stays flat
Fix:
- tighten selection for role-specific traits
- run realistic job previews
- stop selling the role in recruiting
Cause 2: Onboarding Breakdown (30 To 90 Day Attrition)
What it looks like:
- agents survive training, then fail in production
- early QA failures spike
- supervisors spend all day fire-fighting
Fix:
- structured 30, 60, 90-day milestones
- dedicated onboarding capacity that does not cannibalize coaching time
- ramp targets aligned to real learning curves
If you are rebuilding onboarding from scratch, use this BPO onboarding plan as the starting template, then tune it to your program type.
Cause 3: Compensation Progression Misalignment (90 To 365 Day Attrition)
What it looks like:
- churn rises after agents become competent
- exit themes mention pay reality, variable comp volatility, or lack of growth
Fix:
- comp transparency
- predictable progression tied to tenure and performance
- real internal advancement examples
Cause 4: Coaching And Development Failure (90 To 365 Day Attrition)
What it looks like:
- agents feel stuck
- QA feels punitive, not developmental
- performance variance stays wide
Fix:
- coaching infrastructure
- QA coverage that supports feedback loops
- supervisors trained to coach, not only manage
If you want a coaching system that survives high churn, see call center coaching and map it to your QA and supervisor cadence.
Industry surveys continue to show leaders treating workforce management and forecasting as weak links, which ties directly to burnout and unmanaged attrition in multi-channel environments, as shown in the NICE workforce management trends survey.
Cause 5: Floor Culture And Environmental Factors
What it looks like:
- churn clusters around specific supervisors or teams
- absenteeism spikes
- agents disengage before they quit
Fix:
- supervisor selection and training
- stable schedules
- clear performance expectations and fair enforcement
Cause 6: Industry Baseline Reality (Not Fully Fixable)
Some attrition is structural to the job.
- Outbound rejection is real
- Night shift work is real
- Emotional labor is real
The operator’s objective is not zero attrition. It is running below baseline and compressing the cost impact of every exit.
BPO Attrition Benchmarks by Operation Type in 2026 (How To Use Them Correctly)
Attrition benchmarks vary by:
- inbound vs outbound
- vertical complexity and regulation
- geography and the labor market
- remote vs onsite
Important: The benchmark that matters most is not the annual number. It is the tenure distribution that produces the annual number.
If your attrition discussion keeps collapsing into schedule coverage, forecasting accuracy, and intraday load spikes, anchor your fix in call center workforce management before you spend more money hiring faster.
What “Benchmark” Actually Means In Operations
Benchmarking is useful for one reason. It tells you whether you are fighting:
- a fixable internal problem (selection, onboarding, coaching, comp structure), or
- an external baseline problem (labor market, shift structure, vertical difficulty), where the goal is to be better than baseline, not perfect.
It is not useful as a vanity comparison. If you benchmark the wrong way, you will intervene at the wrong layer.
Remote Vs. On-site Is Not A Culture Debate, It Is A Churn Variable
Remote programs often reduce friction drivers that create exits:
- commute cost and time
- rigid schedules tied to physical locations
- floor stress and supervisor presence effects
Remote also introduces operational risk if you do not have the controls:
- schedule adherence visibility
- QA coverage
- tooling discipline and secure environments
If your remote model depends on visibility and control, desktop monitoring for offshore teams is one of the simplest ways to reduce “unknown unknowns” that create churn and quality drift.
Operator move: treat remote as a performance model. If you cannot enforce standards remotely, you will convert “lower churn potential” into “quality risk.”
The Only Benchmark Comparison That Is Safe
If you want to compare your floor to a benchmark, compare these three numbers:
- annualized attrition
- percent of exits in the first 90 days
- percent of active agents past day 90
If you only compare annualized attrition, you can “benchmark” yourself into the wrong intervention.
The Benchmark That Predicts Whether You Have A Fixable Problem
Ask two questions:
- What percent of exits happen in days 0 to 90?
- What percent of active headcount is past day 90?
If most exits occur in the first 90 days, you have a selection and onboarding problem. That is highly fixable.
If exits are spread evenly across the tenure curve, you have a structural comp and career path problem. That can be fixed, but it costs real money and requires operator discipline.
Macro Labor Churn Context (Why Benchmarks Stay Elevated)
Turnover pressure is not isolated to call centers. U.S. labor turnover data continue to show high levels of quits and separations across the economy, creating constant competition for frontline labor, as shown in the BLS JOLTS report.
Use this macro context to avoid a common mistake: assuming your attrition is “a call center problem only” when the labor market is pushing churn across most frontline roles.
Common Mistakes in Call Center Attrition Management
These mistakes show up in operations that stay stuck at high churn for years.
Mistake 1: Treating Attrition As An HR Problem
Attrition is an operations KPI. HR can help execute. HR cannot own the fix.
If you want a clean owner map for what “operations ownership” actually looks like, use call center management as the baseline for roles, cadence, and accountability.
Mistake 2: Measuring Only Annual Attrition
Annual attrition is the symptom. Tenure distribution is the diagnosis.
Mistake 3: Defaulting To Pay As The Only Lever
Pay matters. Pay alone rarely fixes structural churn.
The Pay Trap In Attrition Management
Pay raises often produce a short-term attrition dip because they reduce marginal exits. Then churn returns because the underlying systems stayed the same:
- Hiring still admits mismatched candidates
- Onboarding still fails in production
- Coaching still collapses under supervisor load
If you want to pay to work, it must be paired with a system that increases agent competence and stability. Otherwise, you raise the cost per hour without raising output per hour.
Mistake 4: Under-Investing In The First 90 Days
If you want the fastest ROI, fix days 0 to 90.
What “Investing In The First 90 Days” Actually Means
This is not a culture program. It is a training and execution plan:
- day one expectations, schedule rules, and call flows documented
- shadowing plan, not just classroom training
- 30-day certification for core call types
- daily micro-coaching in week one, then weekly coaching through day 90
- performance targets that ramp in stages, not a full quota at day 14
Mistake 5: Letting Coaching Collapse During Churn Cycles
High churn increases supervisor load. That is exactly when coaching must be protected.
Mistake 6: Benchmarking Against The Wrong Operation Type
Outbound financial services are not comparable to general inbound customer service. If you benchmark against the wrong category, you will misdiagnose the problem and waste budget.
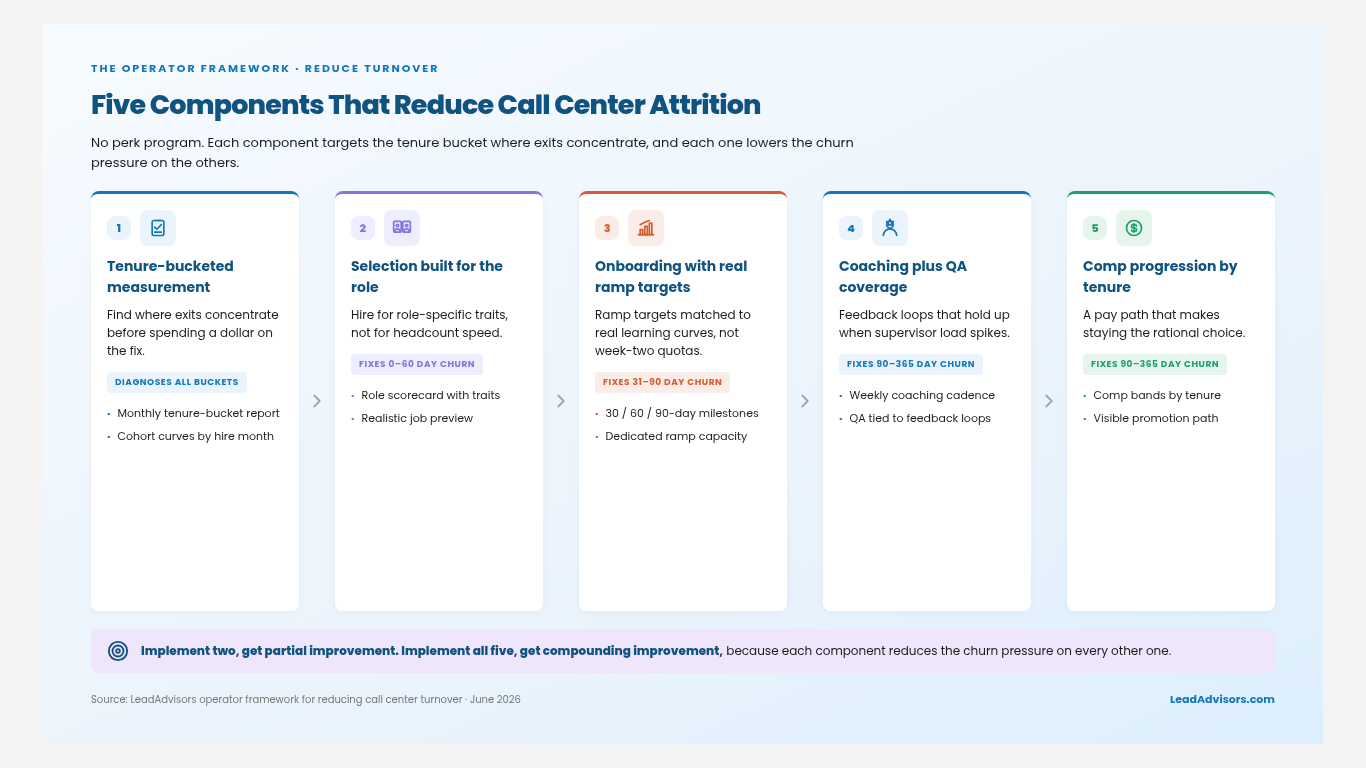
The Operator Framework: Five Components That Reduce Call Center Attrition
This is the system that reduces call center turnover without building a perk program.
Component 1: Tenure-Bucketed Measurement Plus Cohort Tracking
Deliverables:
- monthly tenure-bucketed attrition report
- cohort retention curves by hire month
- separation themes mapped to tenure bucket
What The Monthly Report Should Look Like (One Page)
Keep it brutally simple:
- a table of exits by tenure bucket
- a chart of cohorts by retention milestones
- top three exit themes by bucket
- the one operator action you are taking this month, tied to the bucket
Component 2: Selection Built For The Role, Not For Headcount Speed
Deliverables:
- role scorecard with trait requirements
- realistic job preview script
- structured interview and assessment
A Selection Checklist That Reduces 0 To 60-Day Churn
- Document the actual work (not the recruiting version).
- Test for role-specific traits.
- outbound: resilience, rejection tolerance, pace
- inbound: patience, detail orientation, calm under pressure
- Run a realistic job preview that includes the hard parts.
- Reject candidates who need a different job, even if you are short-staffed.
If you do not protect selection under pressure, you convert headcount speed into long-term churn.
Component 3: Onboarding With Dedicated Capacity And Real Ramp Targets
Deliverables:
- 30, 60, 90-day milestones
- ramp targets that match reality
- onboarding coaches who are not your floor supervisors
A 30, 60, 90-Day Onboarding Blueprint (Minimal Version)
Day 0 to 30
- certify call flow basics
- certify compliance and required language
- daily side-by-side support
Day 31 to 60
- certify objection handling and recovery
- start exposure to the harder call types
- weekly coaching cadence becomes consistent
Day 61 to 90
- certify performance consistency, not peak performance
- move agents into the regular coaching loop
This is how you convert training into production readiness.
Component 4: Coaching Infrastructure Plus QA Coverage That Produces Feedback Loops
Deliverables:
- weekly coaching cadence per agent
- QA system that links findings to coaching themes
- supervisor enablement for coaching, not just enforcement
If you want to reduce compliance risk while improving retention, align your QA workflow to a dedicated QA and compliance program so feedback loops are consistent across supervisors and shifts.
Coaching That Works In High-Churn Floors
If churn is high, supervisors get consumed by onboarding and fire-fighting. Your coaching system must be resilient:
- standardize coaching templates
- group agents by coaching themes, not only by teams
- link QA findings to one weekly skill focus
- protect coaching time the same way you protect dial time
What “QA Coverage” Means In 2026
Most teams still treat QA as sampling. Sampling can work in low-risk environments. In regulated or high-performance programs, sampling creates blind spots:
- Agents do not know which calls matter, so standards drift
- Supervisors coach from fragments, not patterns
- Compliance risk shows up late
Operator move: expand QA coverage using tooling and structured scorecards. The goal is not surveillance. The goal is feedback loops that create faster proficiency and lower churn.
Component 5: Compensation Progression Aligned To Tenure Reality
Deliverables:
- comp bands and progression by tenure
- predictable variable comp structures
- clear promotion path with timelines
Compensation Reality Check
If you lose agents after they become competent, you are paying for training your competitors. The fix is not necessarily “pay more.” The fix is a comp structure that makes staying rational:
- predictable base pay that tracks market reality
- variable comp that pays reliably at benchmark performance
- a visible step-up at defined tenure milestones
Framework close: If you implement two components, you get partial improvement. If you implement all five, you get compounding improvement because each component reduces churn pressure on the others.
What Operators And Agents Say When Attrition Spikes (Field Patterns That Map To The Framework)
In peer discussions and frontline threads, themes repeat. Treat these as a signal, not as proof.
Early-Tenure Themes (0 To 90 Days)
- role mismatch, expectation gaps
- poor ramp structure
- thin coaching in the first weeks
- schedule chaos and inconsistent enforcement
Mid-Tenure Themes (3 To 12 Months)
- no skill development path
- comp progression does not materialize
- QA feedback feels punitive
Structural Themes
- high emotional load
- compliance pressure
- night shifts and sleep debt in offshore programs
Operator move: map the themes to tenure buckets, then fix the system that produces exits in that bucket.